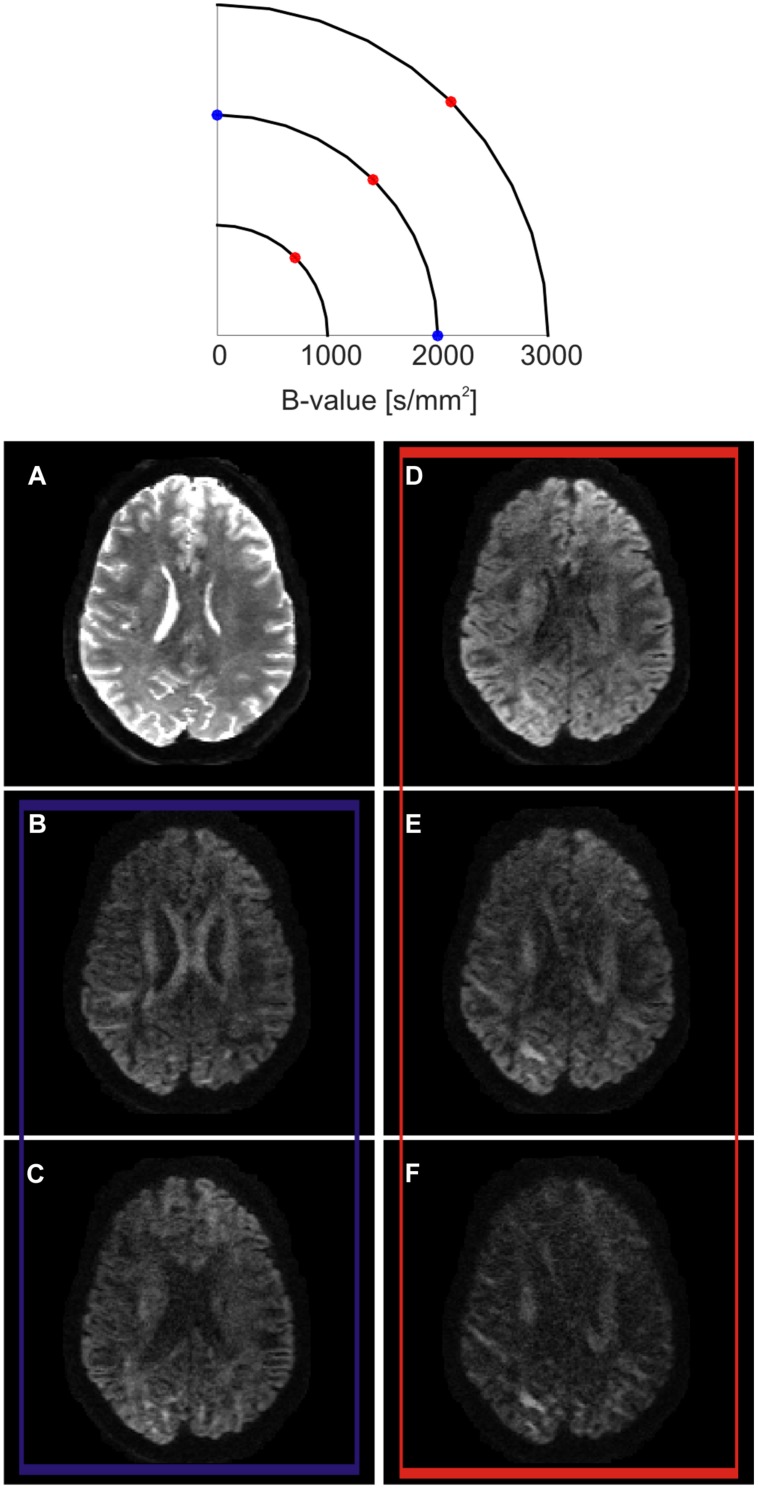
FIGURE 2.
Q-space encoding example. Q-space is represented as a two dimensional space for simplification purposes (top). Three different shells at three different b-values are outlined. On each shell, several diffusion encoding directions (q-vectors) are sampled. Example axial slice obtained at different positions in q-space (bottom). (A) When the diffusion encoding gradients are switched off, the so-called T2-weighted b0 volume is obtained. (B,C) show the effect of sampling q-space at two different diffusion encoding orientations lying on the same b-shell. While SNR and amount of probed diffusion are kept constant, the contrast changes at different anatomical locations. When sampling along the left–right direction, the body of the corpus callosum show a higher signal drop (C) in respect to the sampling along the anterior-posterior direction (B). This reflects the fact that, in the body of the corpus callosum, axons are mainly oriented along the left–right orientation. (D–F) show the effects of sampling along the same diffusion encoding orientation while increasing b-value. In this case, the total SNR decreases while moving from lower to higher b-values, but the contrast increases. As an effect, different anatomical structures are more strongly differentiable between each other according to their main axonal orientation.

