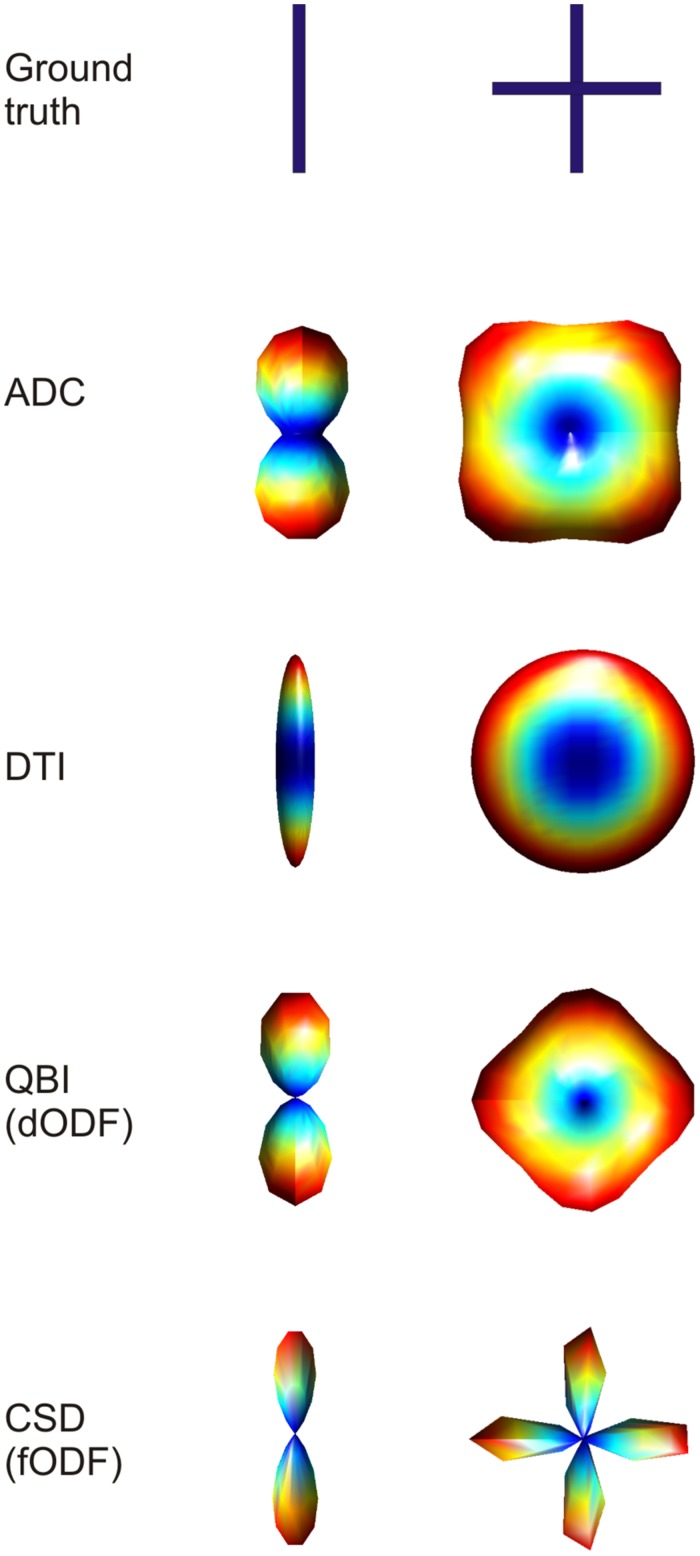
FIGURE 3.
Example of three-dimensional profiles obtained using different dMRI methods in the case of single fiber configuration and two fibers crossing at 90° (top row). Visualizing the three-dimensional ADC profile, it can be seen that in the case of crossing fibers, the maxima do not coincide with the true fiber orientations. When using diffusion tensor imaging (DTI), the single fiber case is reconstructed accurately, with the ellipsoid being very anisotropic in the direction of the fiber. When two fibers are crossing the DTI derived ellipsoid will turn into a disc, losing the possibility to discriminate the two main orientations. The last two techniques shown, namely QBI and CSD, reconstruct the three dimensional orientation distribution functions more accurately. The figure shows that the dODF looks less sharply defined when compared to the fODF.

