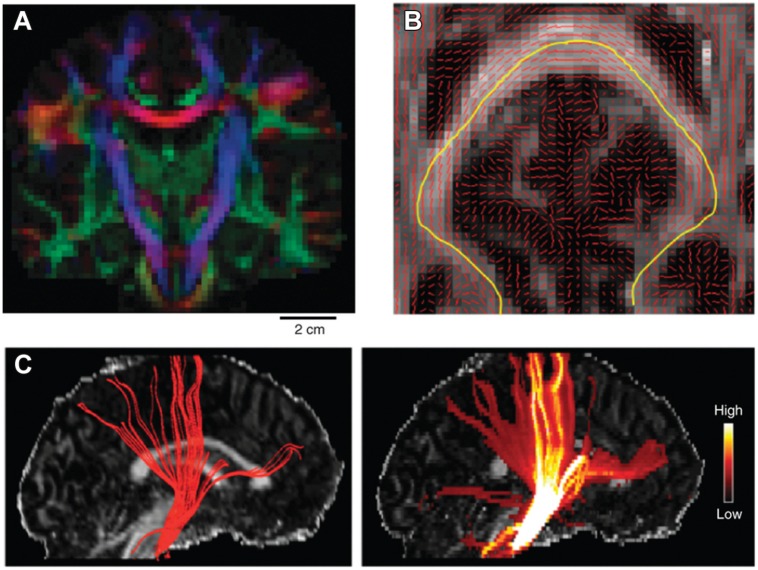
FIGURE 4.
Example of tractography algorithms. (A) shows the main DTI eigenvector orientation as a RGB color coded map of a single coronal slice of the human brain. This is obtained by separately mapping the x, y, and z component of the main eigenvector on the three separate color channels of the RGB color scale (scale bar: 2 cm). (B) shows the main eigenvector orientation visualized on top of a FA axial slice. An example streamline is mapped in yellow, which follows the main path crossing the corpus callosum. (C) shows the results of tracking the pyramidal tract using a deterministic (left) and a probabilistic (right) approach superimposed on a FA sagittal slice. Color bar on the right indicates the confidence estimate obtained when using probabilistic approaches. Reprinted by permission from Macmillan Publishers Ltd (Craddock et al., 2013).

