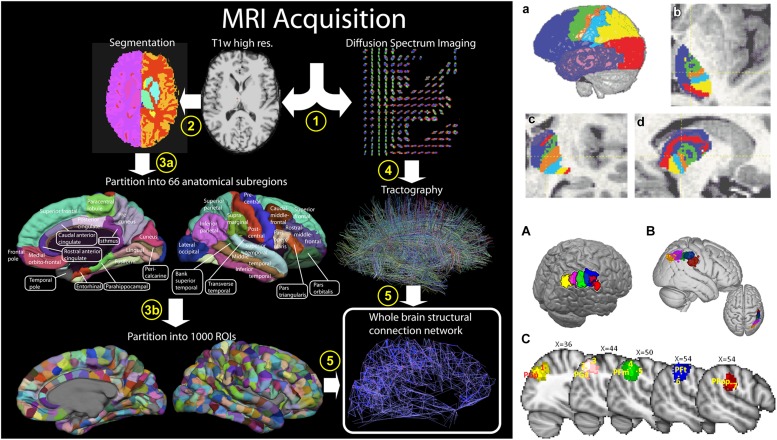
FIGURE 5.
Two different approaches to the macroscale mapping of the brain anatomical connectivity. The left column shows the “connectome approach” processing pipeline. In this case, two processing streams are used to define the nodes (cortical areas) and the edges (fiber tracks), obtained using T1-weighted image segmentation and dMRI-based tractography, respectively. The right column shows the “clustering approach.” In this case, the nodes are defined from clustering connectivity information obtained from tractography. Parcellations of the thalamus (top row) and of the inferior parietal lobule (IPL, bottom row) are shown as examples of anatomical delineation of subcortical and cortical structures, respectively. Right column figure has originally been published in Hagmann et al. (2008). Left column, top row figure is reprinted by permission from Macmillan Publishers Ltd (Behrens et al., 2003a). Left column, bottom row figure is republished with permission of the Society for Neuroscience, from Mars et al. (2011); permission conveyed through Copyright Clearance Center, Inc.

