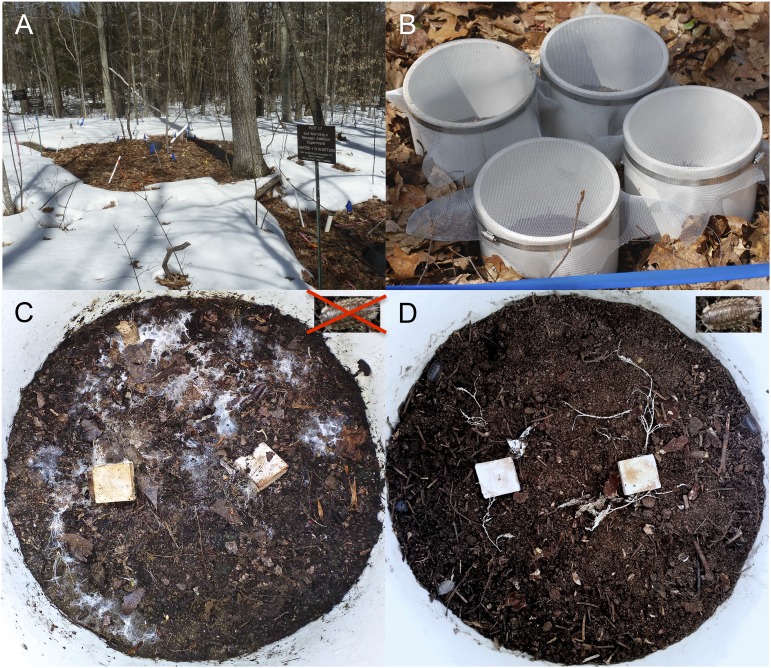
Fig. 1.
Digital images showing (A) the Harvard Forest warming plots (although the study was conducted in the fall, this image was captured in winter to delineate the warming plots clearly); (B) the arrangement of biotic treatment mesocosms within each abiotic plot; (C) the surface of the soil (under the litter layer) within a warming+nitrogen addition plot in the absence of isopods; and (D) the surface of the soil within a warming+nitrogen addition plot in the presence of grazing isopods.

