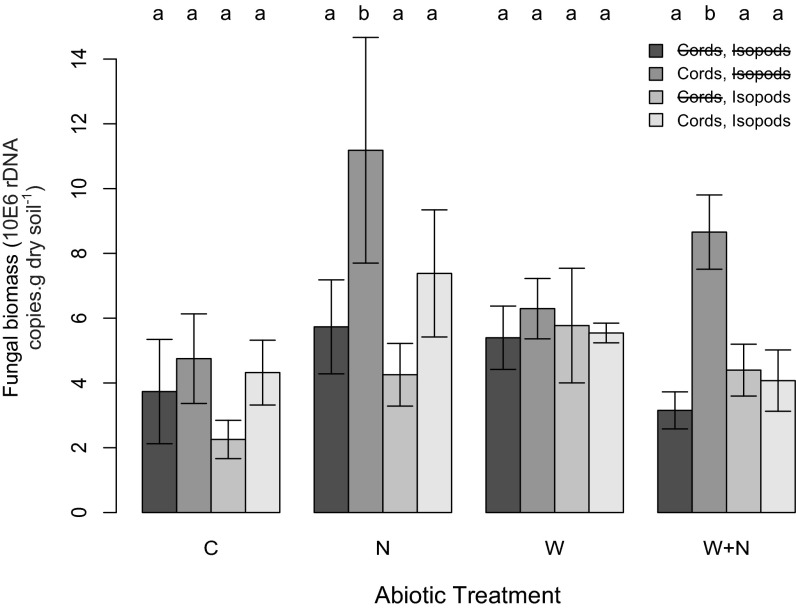
Fig. 2.
Relative fungal sequence copies (mean ± SE) in treatment chambers, estimated using quantitative PCR. Fungal copy numbers were estimated by amplifying the ITS1/qITS2* universal primers. Bar color represents the biotic manipulation (darkest = −fungal cords,−isopods; second darkest = +fungal cords,−isopods; third darkest = −fungal cords,+isopods; lightest = +fungal cords,+isopods) within abiotic treatments (C, control; N, nitrogen addition; W, warmed; W+N, warming+nitrogen addition), showing how the presence of fungal cords enhanced fungal biomass in soil with nitrogen amendment, an effect that was mitigated by isopod grazing. Letters above the bars indicate significant (P < 0.05) differences between treatments. Note that error bars are included, but they cannot accurately represent the variation explained by the random effects of plot and soil moisture in the mixed-effects model.

