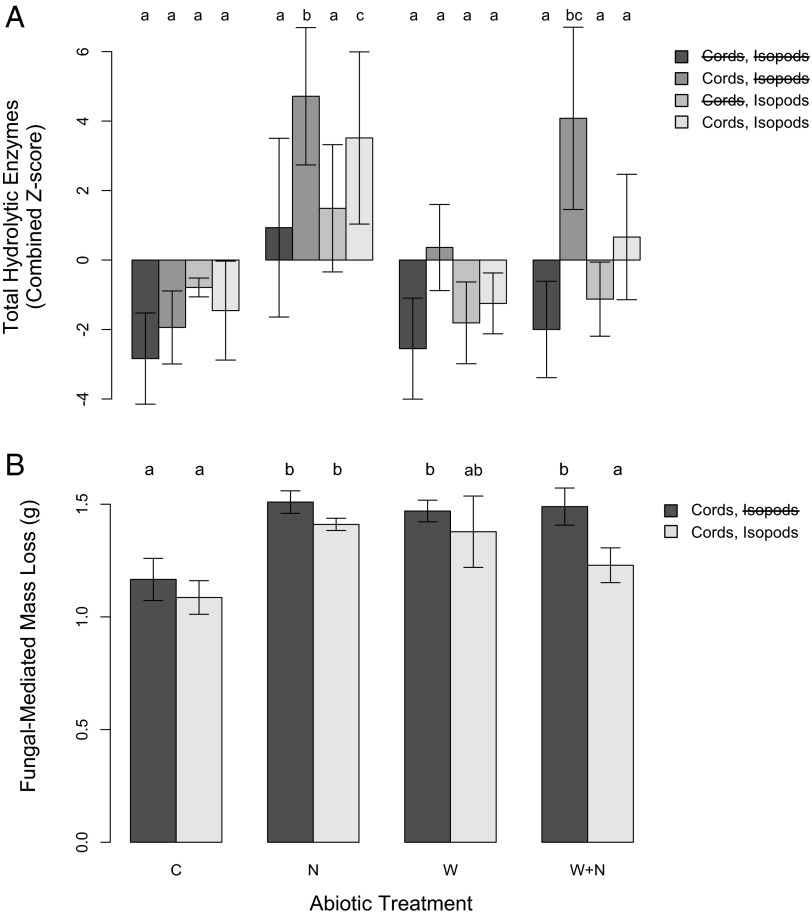
Fig. 3.
Total standardized hydrolytic enzyme production (A) and wood decomposition (B) rates across all treatments. Z-scores were calculated for all enzymes to minimize the overriding effects of the most active enzymes detected. This value represents the number of SDs from the mean value for that enzyme across all 96 treatment chambers. Standardized values for each enzyme were summed to get an estimate of relative changes in total enzyme production. Values represent means across biotic and abiotic treatments (C, control; N, nitrogen addition; W, warmed; W+N, warming+nitrogen addition). Letters above bars indicate significant (P < 0.05) differences between treatments. Error bars cannot accurately represent the variation explained by the random effects of plot and soil moisture in our mixed effects model. Despite the effects of the global change factors on hydrolytic enzymes, no abiotic treatments significantly influenced the abundance of oxidative enzymes in soil, which were affected only by the presence of cord-forming fungi (F1,53 = 17.740891, P = 0.0001).

