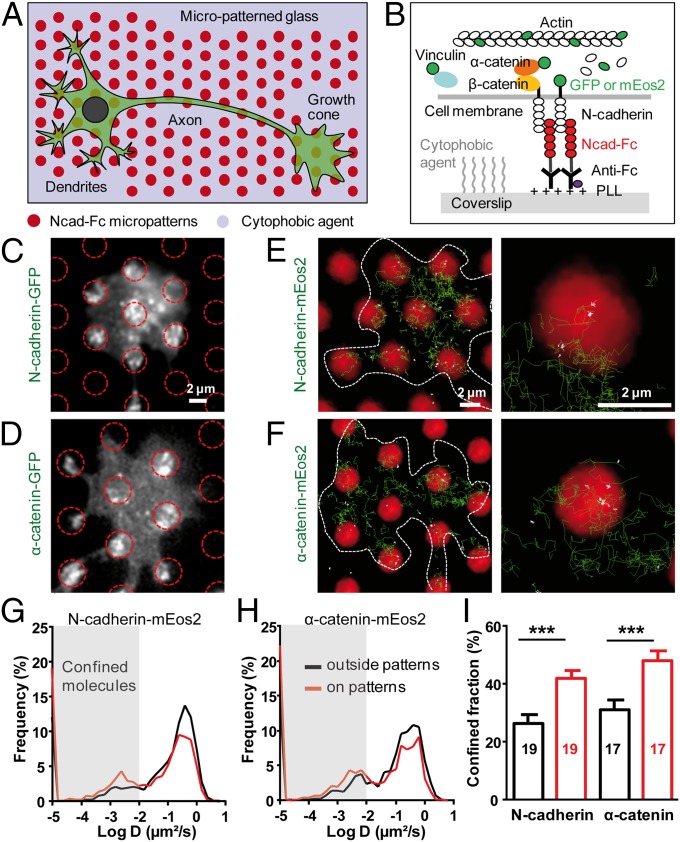
Fig. 1.
Membrane N-cadherin and α-catenin are selectively immobilized at N-cadherin micropatterns. (A) Neurons were cultured on micropatterned glass substrates comprising regularly spaced Ncad-Fc–coated dots (red) separated by a cytophobic agent (violet). (B) Side view of the molecular interactions at the N-cadherin/actin interface. (C and D) Epifluorescence images of growth cones expressing Ncad-GFP or α-catenin–GFP on Ncad-Fc patterns (red circles). (E and F, Left) Individual trajectories of N-cadherin–mEos2 (Ncad-mEos2) or α-catenin–mEos2 molecules (green) superimposed on Ncad-Fc patterns (red). (E and F, Right) In higher magnification images, confined trajectories with D < 0.01 μm2⋅s−1 are white, whereas Brownian trajectories with D > 0.01 μm2⋅s−1 are green. (Scale bars: C–F, 2 μm.) (G and H) Distributions of diffusion coefficients for Ncad-mEos2 and α-catenin–mEos2 molecules, respectively, at Ncad-Fc patterns or outside regions (between 1,222 and 4,062 trajectories analyzed). Gray-shaded areas represent confined molecules with D < 0.01 μm2⋅s−1. (I) Corresponding fraction of confined trajectories. Data represent the mean ± SEM of confined fractions (***P < 0.0001 by paired Student’s t test). The number of growth cones examined is given in each column.

