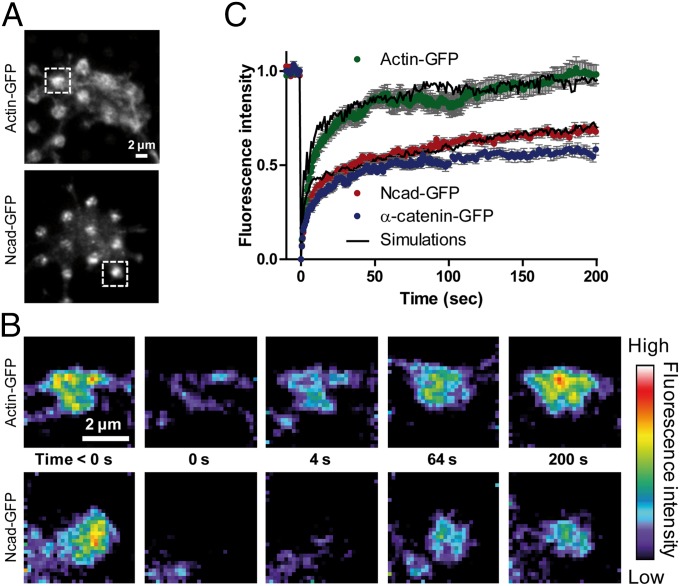
Fig. 4.
FRAP on actin-GFP, α-catenin–GFP, and Ncad-GFP accumulated at N-cadherin micropatterns. (A) Growth cones from neurons expressing Ncad-GFP or actin-GFP were observed by TIRF illumination, revealing significant enrichment of both proteins at Ncad-Fc patterns (circles). (Insets) Regions selected for photobleaching. (B) Ncad-GFP or actin-GFP signals were photobleached on two to three patterns per cone, with an ∼300-ms laser pulse, and the fluorescence recovery was recorded for 200 s (color coding). (Scale bars: A and B, 2 μm.) (C) Graphs of fluorescence recovery over time for Ncad-GFP, α-catenin–GFP, and actin-GFP. Solid dots represent the average of three independent experiments [10–20 growth cones, 18–50 patterns per condition ± SEM (gray)], and plain curves are the average of three independent simulations.

