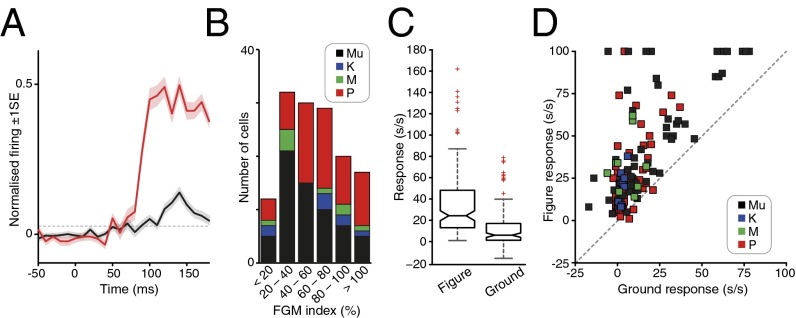
Fig. 2.
Population summary data. (A) Averaged population responses to figure (red) and ground (black) stimulus conditions overlying the RF. Shading represents ±1 SE. Motion onset occurred at time 0 ms. Horizontal dotted line denotes background plus 99% confidence limit. See Materials and Methods (last paragraph) for full details of the normalization procedure. (B) Bar group-histogram plots the distribution of FGM (in percent) across our sample for multiunits (Mu, black), Parvocellular (P, red), Magnocellular (M, green), and koniocellular (K, blue) cells. The median FGM was 56 ± 6.07% SE; n = 140. The FGM values for each monkey were 60% (±5.69 SE; n = 91) and 45% (±12.84 SE; n = 49), respectively. There was no significant difference between the FGM values observed for the two monkeys for either the single unit data, the multiunit data, or combined single and multiunit data sets (P > 0.05 for each comparison, Wilcoxon matched pairs test). Our single unit population sample was largely comprised of parvocellular (P) cells (n = 60), although we also obtained some recordings from both koniocellular (K; n = 8) and magnocellular (M; n = 9) cells. Across our single unit data, there was no significant difference in either the magnitude of the FGM index (P = 0.7172, Kruskal-Wallis ANOVA) or proportion of cells exhibiting the effect (P = 0.118, Freeman Halton extension of Fisher Exact Probability test) across the three cell groups. (C) Box-notch plots of figure (Left) and ground (Right) responses (in s/s after subtraction of background activity). The horizontal line in the middle of the box shows the median response, and the notch limits signify the 95% confidence interval around the median; box limits signify 25th and 75th percentiles of the data, and the extended whiskers show 1.5 times the interquartile range. Responses outside a range 1.5 times the width of the interquartile range from the median are shown as separate points (red crosses). The two notches do not overlap vertically; thus, the corresponding medians are different at the 5% level. (D) Distribution of ground responses versus figure responses [in spikes per second (s/s) after subtraction of background activity] across the cell sample. Dashed line denotes the diagonal representing equal responses to both stimuli. Negative values represent cases where responses to ground stimulation were reduced below the background firing rate (27). Color conventions as in B.

