Fig. 1.
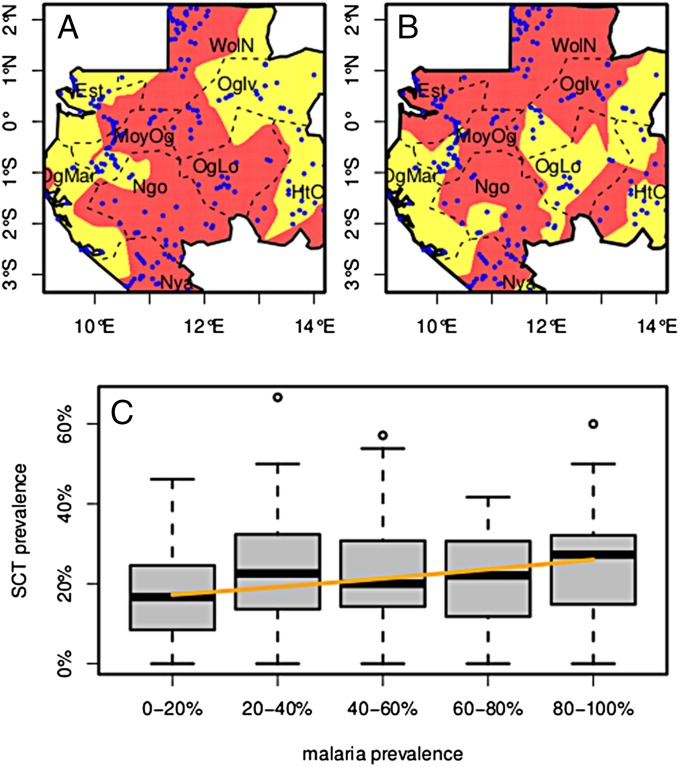
Map of Gabon. (A) SCT prevalence. Pale yellow, prevalence less than 10%; dark red, prevalence more than 10%; blue dots, sampled villages; dotted lines, province limits. (B) Malaria prevalence. Pale yellow, prevalence less than 30%; dark red, prevalence more than 30%. To generate these maps for each cell of a 200 × 200 grid covering the country, prevalence was computed from the pooled populations of all villages within a 0.5 degree of latitude/longitude radius. Province names abbreviations: Est, Estuaire; HtOg, Haut-Ogoouée; MoyOg, Moyen-Ogoouée; Ngo, Ngounié; Nya, Nyanga; Oglv, Ogouée-Ivindo; OgLo, Ogoouée-Lolo; OgMar, Ogoouée-Maritime; WolN, Woleu-Ntem. (C) SCT prevalence as a function of P. falciparum prevalence. Villages have been grouped by 20%-wide intervals of Pf prevalence. Boxes extend from the 25% to the 75% of the distribution, whiskers extend to 1.5 times the interquartile range, and circles show extreme values. The orange line shows the SCT prevalence prediction of the statistical model as a function of Pf prevalence alone. Age has been set to its median value (49 y), and the random effects have been set to zero.

