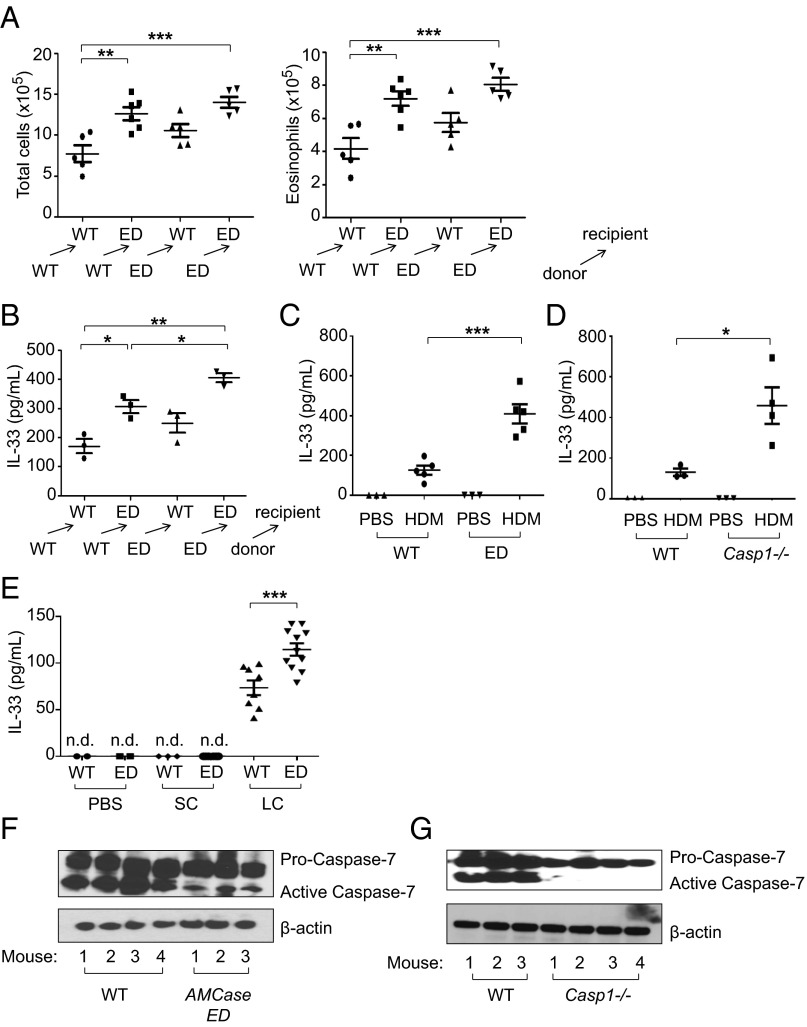
Fig. 5.
Enhanced production of IL-33 in AMCase-ED mice after administration of HDM or chitin. (A) The number of total cells (Left) and eosinophils (Right) in the BAL of WT → WT (where WT bone marrow was injected into irradiated WT recipients), WT → AMCase-ED, AMCase-ED → WT, or AMCase-ED → AMCase-ED mice after administration of HDM. (B) Production of IL-33 in the BAL of WT → WT, WT → AMCase-ED, AMCase-ED → WT, or AMCase-ED → AMCase-ED mice after administration of HDM. (C) Production of IL-33 in the BAL of WT or AMCase-ED mice after administration of PBS or HDM. (D) Production of IL-33 in the BAL of WT or Casp1−/− mice after administration of PBS or HDM. (E) Production of IL-33 in the BAL of WT or AMCase-ED mice after administration of PBS, small chitin, or large chitin. (F) Immunoblot analysis of caspase-7 and β-actin in lung lysates from WT mice or AMCase-ED mice after administration of PBS or HDM. The number indicates the individual mouse. (G) Immunoblot analysis of caspase-7 and β-actin in lung lysates from WT mice or Casp7−/− mice after administration of PBS or HDM. The number indicates the individual mouse. *P < 0.05, **P < 0.01, and ***P < 0.001, unpaired Student’s t test. Data were combined from at least three independent experiments. Error bars indicate the SEM.

