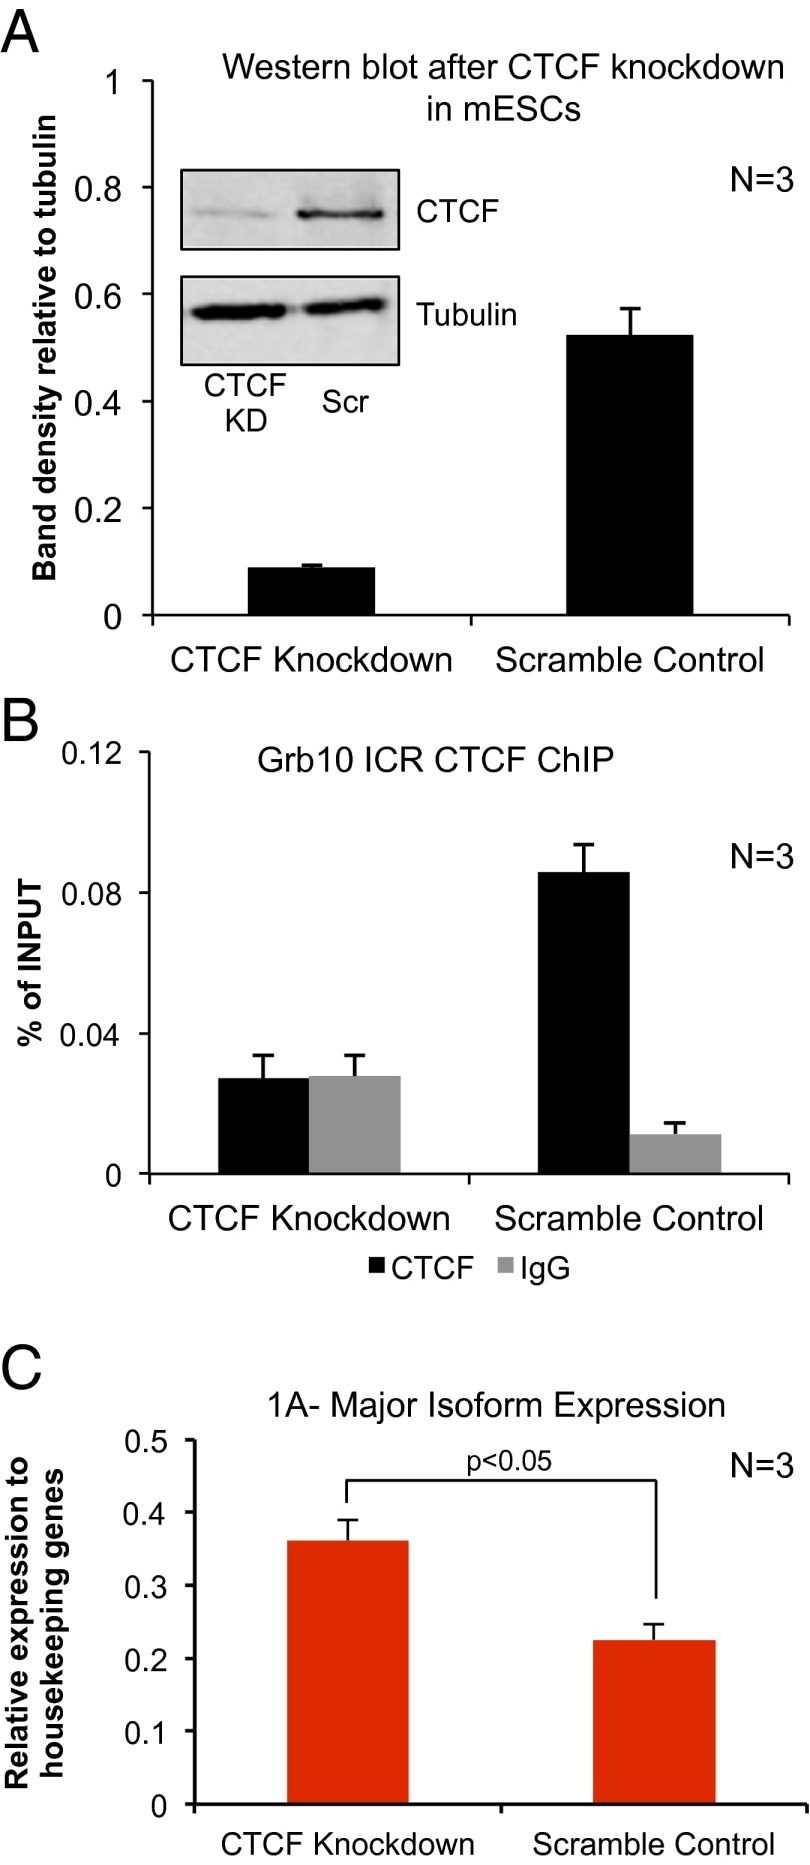
Fig. 3.
Grb10 expression in mouse embryonic stem cells after CTCF knockdown results in the up-regulation of the major isoform. (A) Representative Western blot for CTCF and tubulin comparing cells infected with CTCF shRNA (KD) and scramble control (Scr). Average densitometry of the CTCF bands across three replicates is shown in the bar graph. (B) CTCF knockdown results in loss of CTCF enrichment over background at the Grb10 ICR compared with IgG. (C) CTCF knockdown causes a small but significant increase in the expression of the major Grb10 isoform (1A).

