Figure 5.
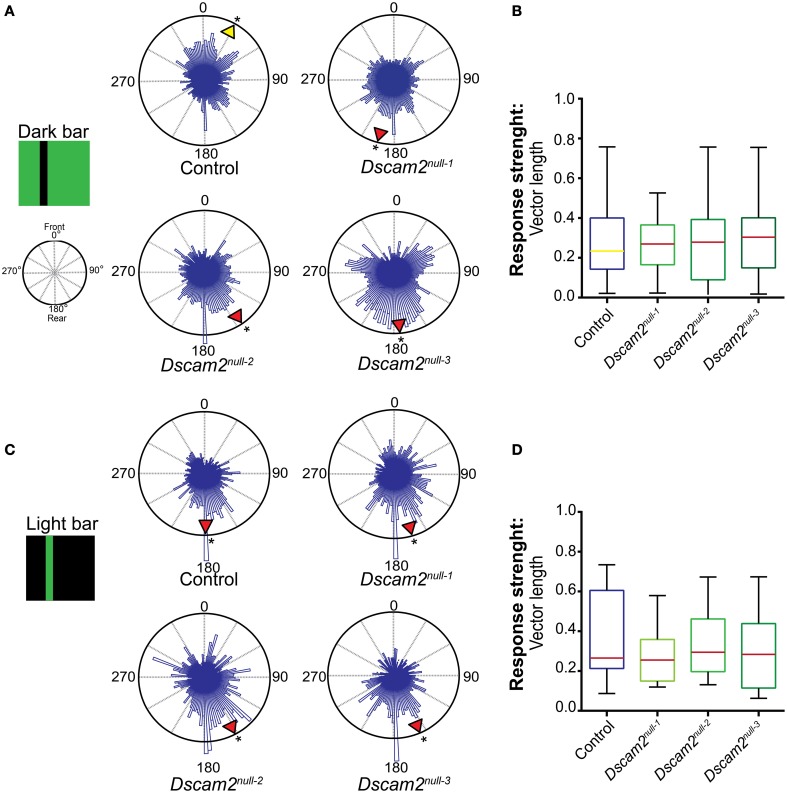
Dscam2 mutant flies have defects in pattern-induced visual orientation. Fixation Assay. Flies were presented with a bar in a closed-loop environment and their preference for the bar position was recorded. The histograms within the 360° circular plots represent a weighted value for each bar position derived from all of the flies from each genotype. For each fly an average direction was calculated, as well as a group mean direction which is graphically represented in the radial histogram as a yellow arrowhead for a heading toward the front of the arena or red arrowhead for a heading toward the back. A Rayleigh test confirmed the distributions were non-random, *p < 0.05. (A) Control flies fixate and Dscam2 mutants anti-fixate on a dark bar. (B) Control flies and Dscam2 mutants demonstrate similar response strengths (indicated by median vector length) and variation for the fixation stimulus. The color of the median line corresponds with the color of the arrowhead (indicating direction) in (A). (C) Control flies and Dscam2 mutant flies both place a light bar toward the back of the arena. (D) Control flies and Dscam2 mutants demonstrate similar response strengths (indicated by median vector length) and variation for the anti-fixation stimulus. As in (B), the variation in strength of the response is visualized in boxplots with min to max whiskers. For all groups at least eight flies were run for every condition. A Kruskal-Wallis test indicated no significant difference between the vector lengths of the different fly strains.

