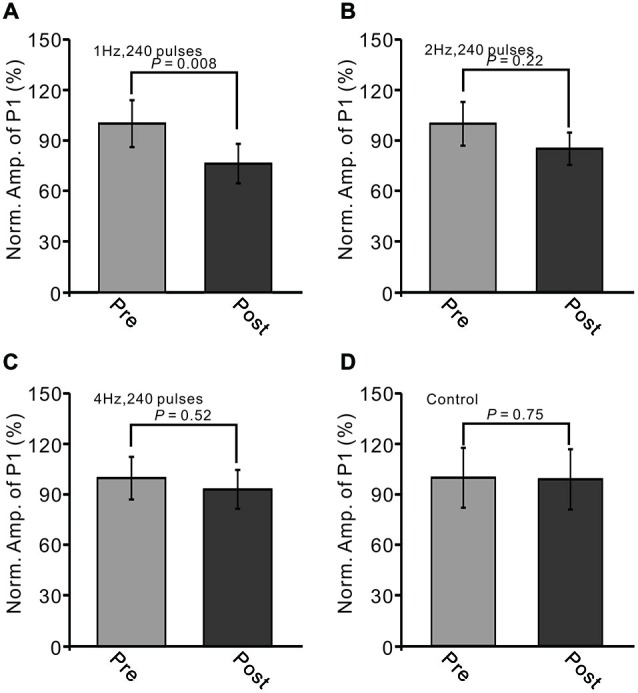
Figure 3.

LTD of sensory-evoked P1 at PCs was induced by 1 Hz, but not by 2 Hz or 4 Hz. (A) Bar graph showing normalized amplitude of P1 before (pre) and after (post) delivery of 2 Hz (240 pulses) stimulation. (B) Summary of data showing normalized amplitude of P1 before (pre) and after (post) 2 Hz (240 pulses) stimulation. (C) Pooled data showing normalized amplitude of P1 before (pre) and after (post) 4 Hz (240 pulses) stimulation. (D) Bar graph showing normalized amplitude of P1 under control conditions (without train of facial stimulation). Note that the amplitude of P1 was depressed after 1 Hz stimulation, but not after 2 or 4 Hz stimulation.
