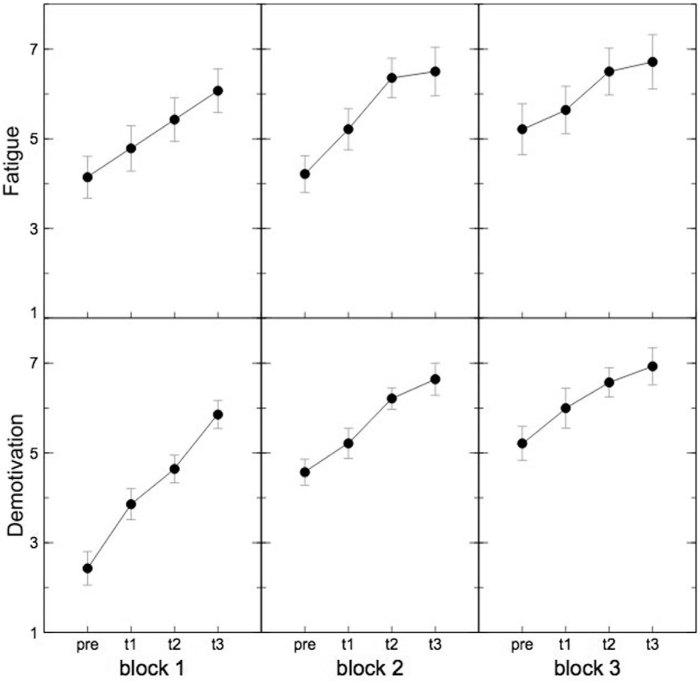
Figure 1.
Subjective ratings. The upper graph shows the subjective rated mental fatigue during the experiment on a 9-step Likert scale. The bottom graph shows the subjective rated motivation to continue with the task during the experiment on a 9-step Likert scale. High mental fatigue or low motivation to continue with the task respectively are represented by high numbers. There is a significant increase of mental fatigue and and a significant decrease of motivation with time on task within the blocks. As error bars standard errors were used.

