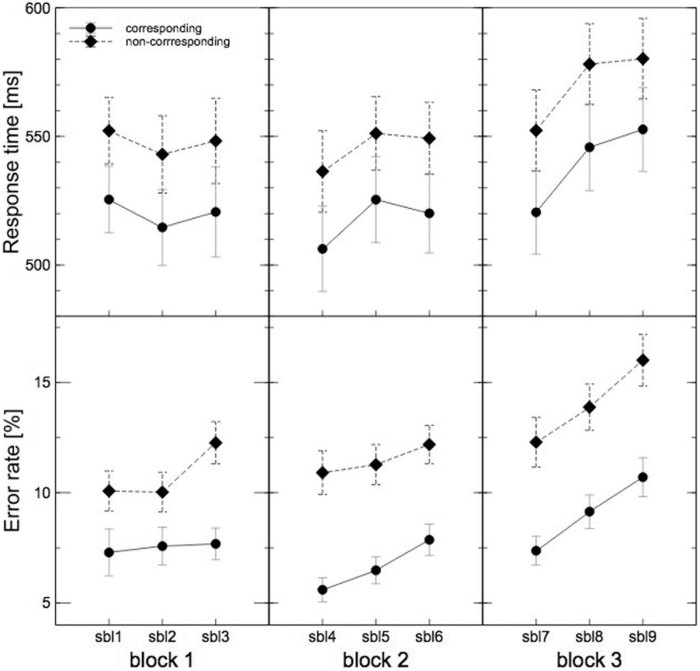
Figure 2.
Behavioural performance. The upper graph shows the response times and the bottom graph the error rates in the course of the experiment. There is a significant increase of response times with time on task. Additionally, there is a significant Simon effect for both behavioural measurements, thus that participants show faster response times and less errors for corresponding compared to non-corresponding trials. For the error rates this effect becomes more pronounced with time on task. As error bars standard errors were used.

