
Figure 3.
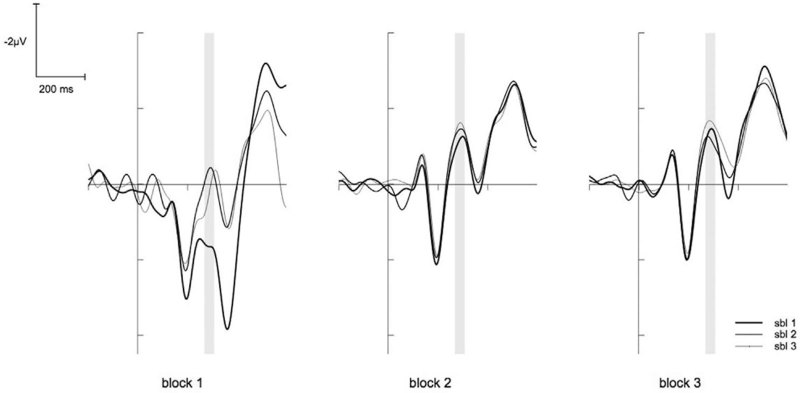
The N2 on FCz. The graph shows the N2 on FCz for the trials for the 9 sub-blocks (sbl). The time window of the N2 is marked by the grey underlining. The N2 amplitude increases with time on task but this effect is mostly explained by a severe increase from sub-block 1 to sub-block 2.