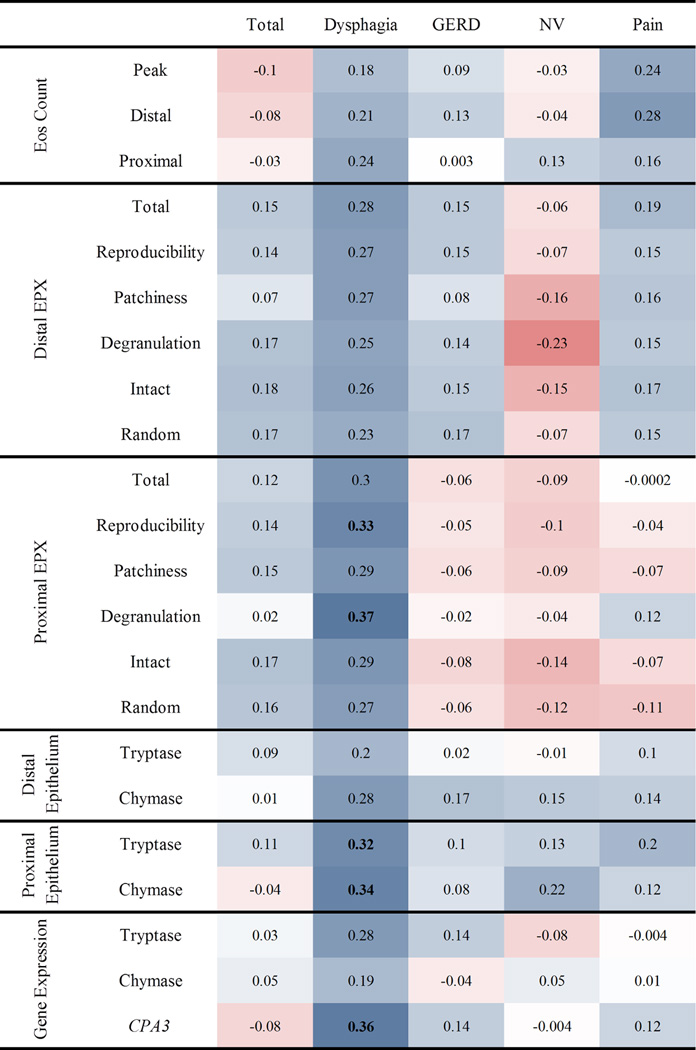
Figure 2. Spearman correlations between PEESS® v2.0 scores and disease parameters.
Strength of the association with a diagnostic subset of the eosinophilic esophagitis transcriptome is measured using Spearman’s ρ (text within cell). Darker red shades indicate stronger negative correlations, whereas darker blue shades indicate stronger positive correlations. Bolded values indicate correlations that are significant at p ≤ 0.05. CPA3, carboxypeptidase A3; Eos, eosinophil; EPX, eosinophil peroxidase; GERD, gastroesophageal reflux disease; NV, nausea/vomiting domain

