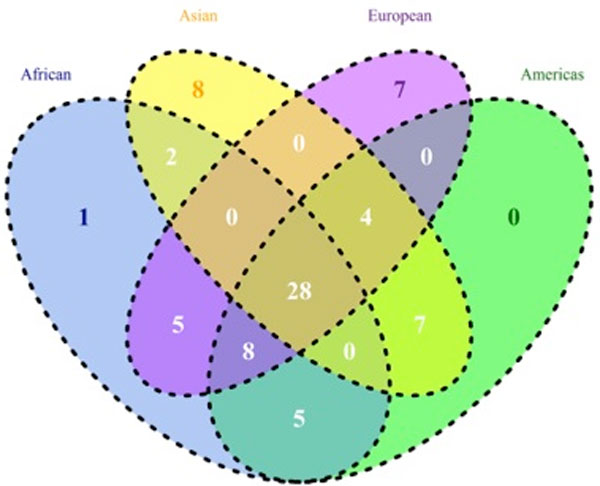
Figure 3.

Venn diagram of the top-50 diseases in the 1000 Genome Project. Circle colors in the Venn diagram indicate African as blue, Asian as yellow, American as green, and European as violet. The numbers shown in this diagram represent the number of diseases in each intersection area or set.
