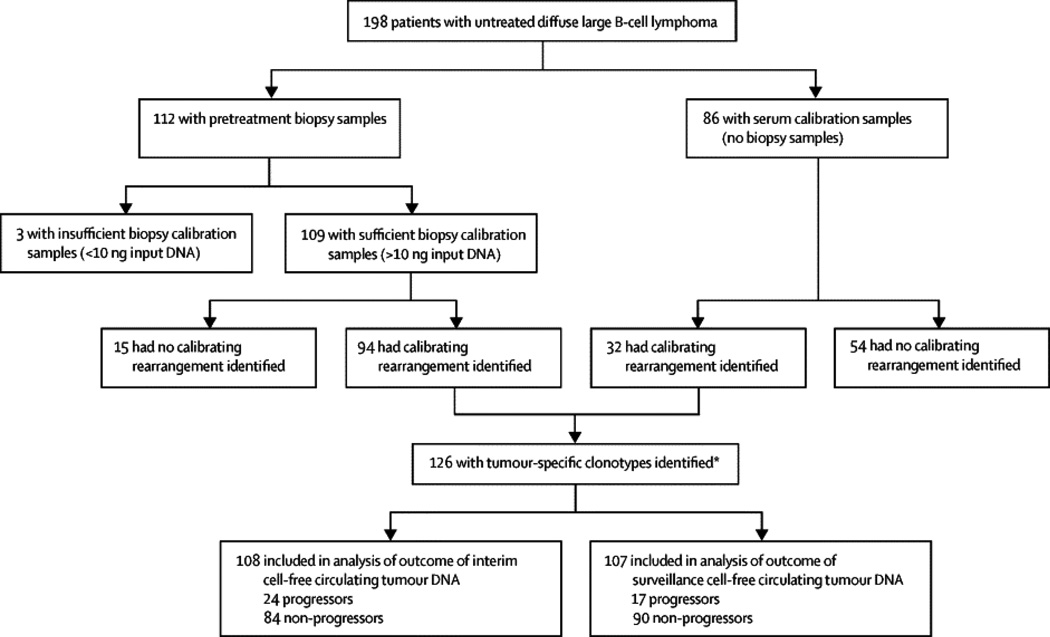
Figure 1. Tumor Clonotype Analysis Work flow.
Step 1a. Tumor DNA was amplified using locus-specific primer sets for the immunoglobulin heavy-chain locus (IGH) complete (IGH-VDJ), IGH incomplete (IGH-DJ), and immunoglobulin kappa locus (IGK). The amplified product was sequenced, and the frequencies of the different clonotypes determined. Step 1b. Tumor clone(s) that comprised at least 5% of the B-cell repertoire were identified for analysis of minimal residual disease (ctDNA). Step 2a. ctDNA in serum samples was calculated based on the number of lymphoma molecules (cell equivalent) per 106 diploid genomes (cell equivalent). The lower limit of detection was 1 lymphoma molecule per 106 diploid genomes. In cases with 2 or more tumor clones, the highest frequency clone was reported. Step 2b. ctDNA was quantitatively analyzed in serial serum samples over multiple time points.

