
Figure 4.
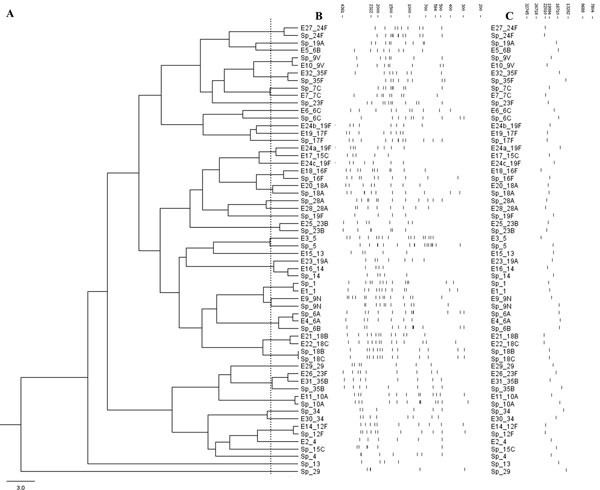
Clustering the experimental and in silico cps-RFLP patterns. (A) Dendrogram showing the results of clustering 31 experimental cps-RFLP patterns (E_*) and the in silico patterns (Sp_*) of the corresponding serotypes. The dashed line represents the distance threshold under which patterns are indistinguishable by MST software; (B) Schematic representation of the cps-RFLP patterns; and (C) their respective cps amplicons. Fragment sizes are in base pairs.