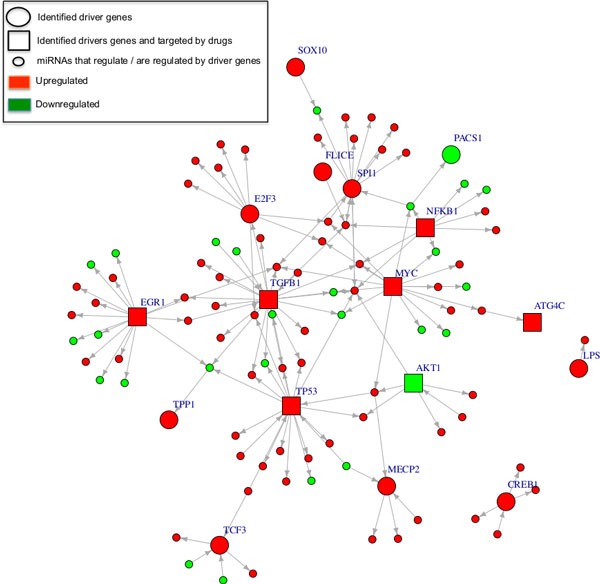
Figure 3.

Regulatory interactions of the 17 key driver genes identified from miRNA-mRNA interactions. Large nodes represent key driver genes and small nodes represent miRNAs, which regulate or are regulated by these driver genes. Square nodes are the identified driver genes that are targeted by drugs. The network was visualized using the Igraph package in R.
