Fig. 4.

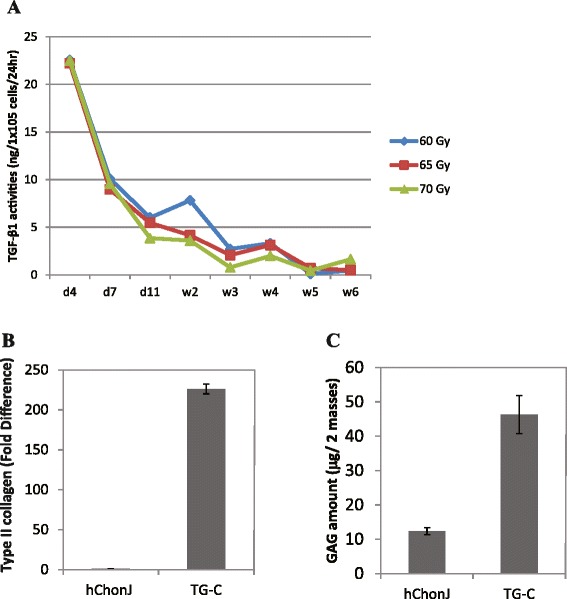
Type II collagen and GAG production by TG-C. a Expression level of TGF-β1 in irradiated hChonJb#7 cells was monitored for 6 weeks after the irradiation. b Type II collagen transcription level in hChonJ or TG-C micro-masses was determined by qPCR. Transcription level of type II collagen was normalized against GAPDH in each condition. The Y-axis shows the standardized fold difference between hChonJ and TG-C. The error bars represent the standard deviation. c GAG amount accumulated in hChonJ or TG-C micro-masses. TG-C masses accumulated about 4 times more GAG than hChonJ masses at the week 1 time point. The error bars represent the standard deviation
