
Fig. 2.
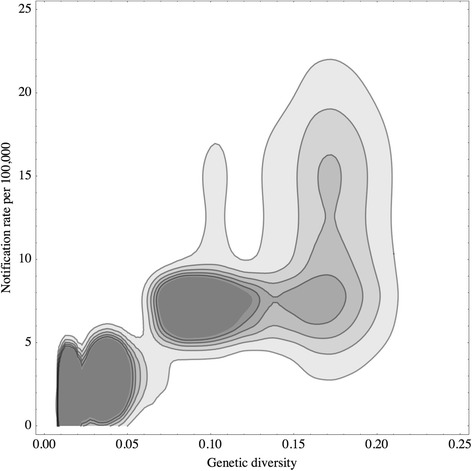
Distribution of Cryptosporidium genetic diversities and notification rates. A pair of estimates regarding the notification rate and the genetic diversity is colored in gray shade according to its probability density. A darker shade indicates a higher probability density. A closed line connects the points at which probability density is equal to a certain value. Estimates are based on the data from four countries: The Netherlands, USA, UK, and Australia