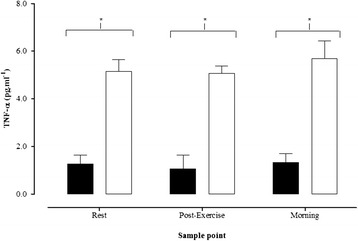
Fig. 1.

Plasma TNF-α at rest, 60 min post-exercise, and on the morning after exercise. Solid black bars = Control group, solid white bars = Type 1 diabetes group. * indicates a significant between group difference (P < 0.05). Data presented as mean ± SEM
