Fig. 5.

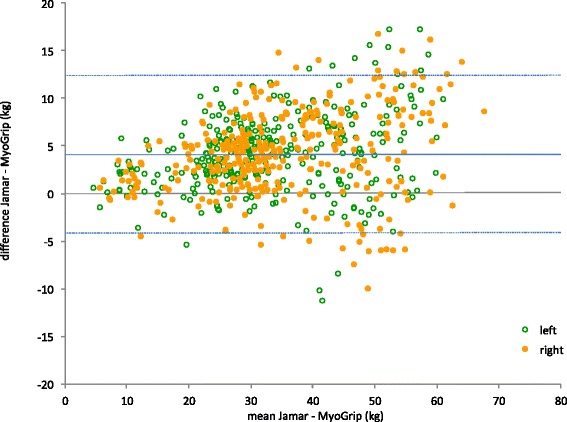
Bland & Altman plots for comparison between MyoGrip and Jamar. Dotted lines represent the limit of agreements between dynamometers

Bland & Altman plots for comparison between MyoGrip and Jamar. Dotted lines represent the limit of agreements between dynamometers