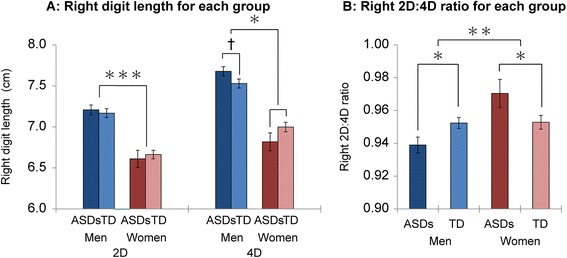
Fig. 1.

Group differences in right digit length and right 2D:4D ratio. Panels a and b show group differences in right digit length and right 2D:4D ratios, respectively. Error bars indicate standard errors of the means. †p < 0.10, *p < 0.05, **p < 0.01, ***p < 0.001
