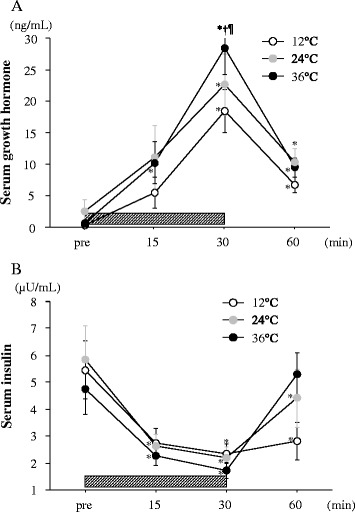
Figure 2.

Change in serum growth hormone (A) and serum insulin (B) concentrations. The shaded bar indicates the duration of exercise. Values are means ± SE. †; Significant difference versus 24°C. ¶; Significant difference versus 12°C. *; Significant difference versus Pre.
