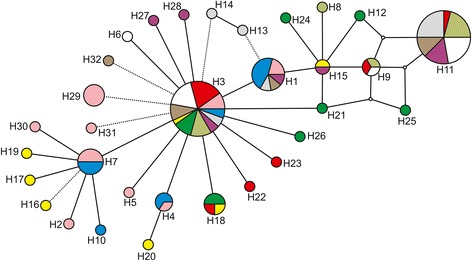
Fig. 2.

Statistical parsimony haplotype network showing the phylogenetic relationship among 32 unique haplotypes observed among ten populations of M. simplex. The circles are the haplotypes and their size represents their frequencies in the total sample, small and white circles are missing estimated haplotypes. Each color corresponds to the populations given in Table 1 and Fig. 1
