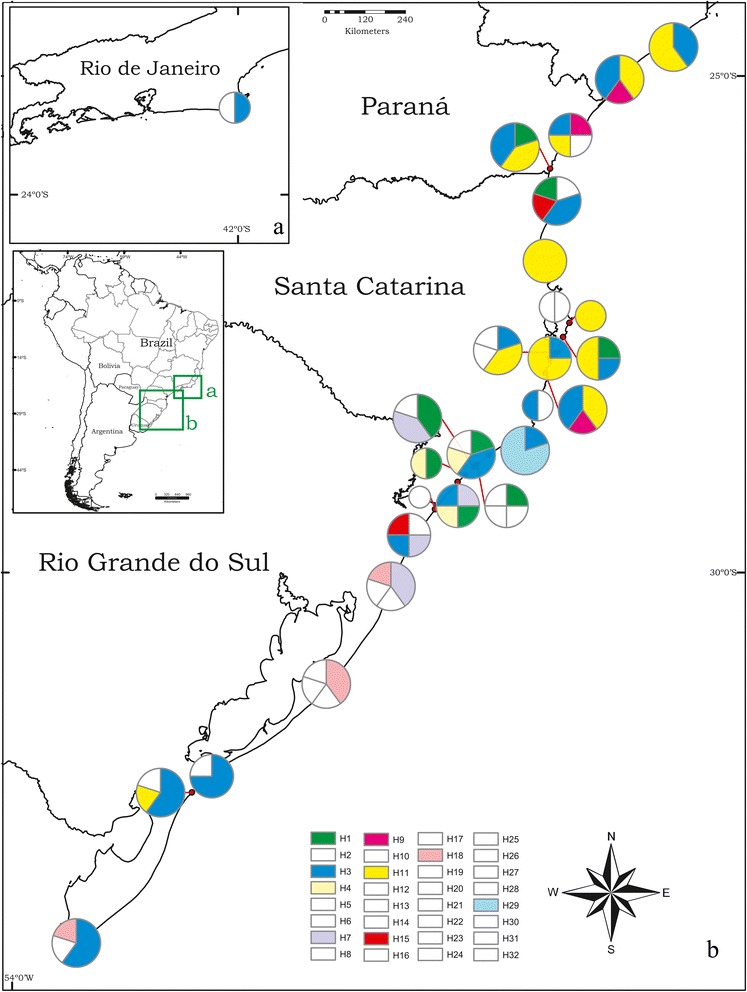
Fig. 3.

Geographical distribution of all 32 cytochrome oxidase I (COI) unique haplotypes observed across the distribution of M. simplex along Atlantic Brazilian coast. The circles are the haplotypes and their size represents their frequencies in the total sample, singletons were suppressed and are shown in white. Colors display frequent haplotypes distributed throughout M. simplex distribution along Atlantic coast. The map was produced using a GIS program with free layers available at IBGE website (www.mapas.ibge.gov.br). The colors of haplotypes do not refer to the previous figures
