
Fig. 4.
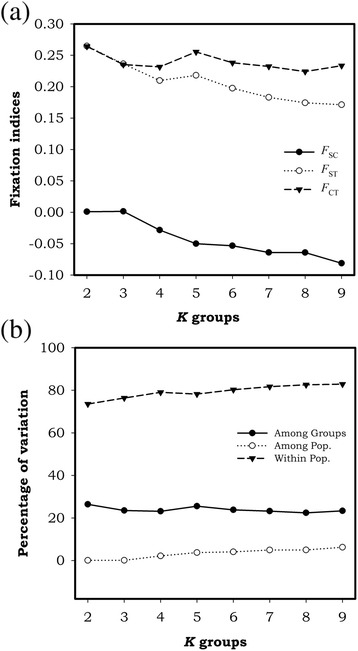
Spatial analysis of molecular variance - SAMOVA of populations of M. simplex. a Fixation indices calculated and b percentage of genetic variation explained by each hierarchical level for the best grouping option for each pre-specified K groups