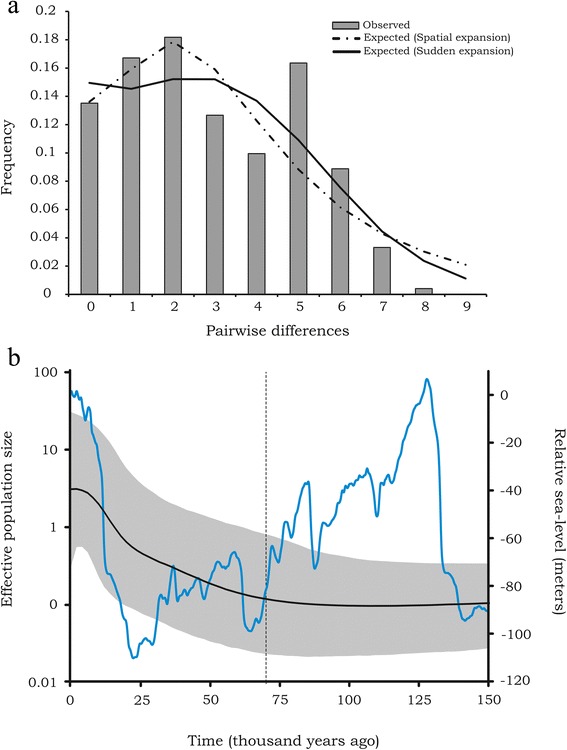
Fig. 5.

Demographic history of M. simplex and relative sea level. a Pairwise mismatch distribution of the mtDNA sequences for total dataset. M. simplex presented a bimodal distribution, but did not reject the spatial expansion model (SDD = 0.0226 p = 0.3803). b Bayesian skyline plot showing the historical demography and complete reconstruction of female effective population size fluctuations throughout the time of M. simplex. Black line represents median estimation and the grey area the upper and lower 95 % confident intervals. Dashed line indicates the beginning of demographic expansion. Blue line shows the sea-level during the last 150,000 years during the Quaternary (from [66])
