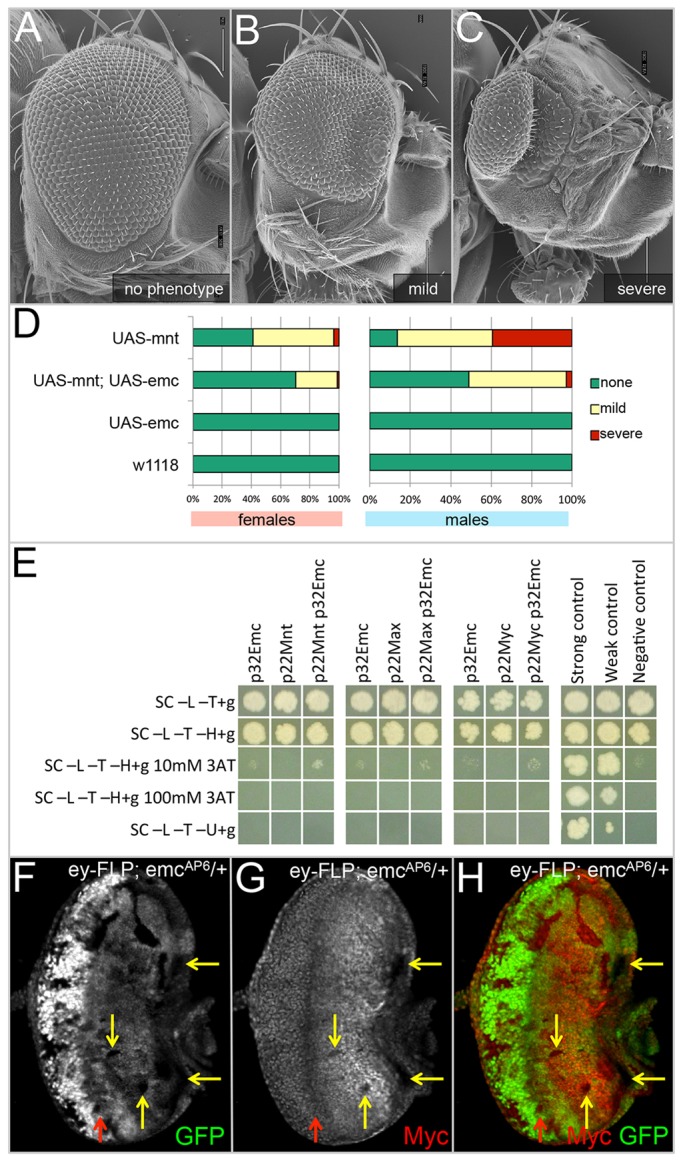
Fig. 5.

Emc interacts genetically with Mnt and regulates Myc expression. (A-C) SEM images displaying the range of phenotypic severity that is observed in ey-GAL4, UAS-Mnt animals. Adult heads were photographed at 180× magnification. (D) Charts displaying the percentage of adult animals categorized according to the phenotypes imaged in A-C. (E) Directed yeast two-hybrid results showing no interaction between Emc and Mnt, Max or Myc. (F-H) Light microscope images of third instar eye-antennal discs containing emcAP6 loss-of-function clones. Dorsal side is upwards and anterior is towards the right. The red arrow indicates the position of the morphogenetic furrow. All discs were photographed at 10× magnification. Levels of Myc antibody staining (yellow arrow) are decreased in emcAP6-null clones.
