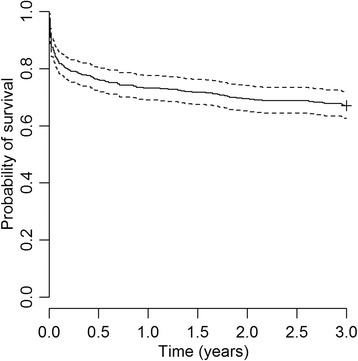
Figure 2.

Kaplan-Meier curve showing the 3-year probability of survival after a first-ever stroke derived from Joinville Stroke Register, 2009–10. Dots on either side of the solid line indicate 95% CIs; n indicates number at risk at the beginning of each year.
