Figure 6.

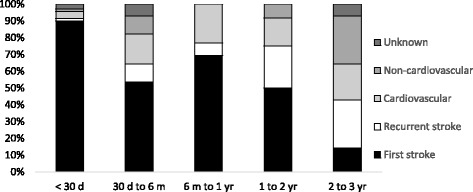
Histogram showing the proportion of patients dying from different causes during different time intervals from the onset of their first-ever stroke.

Histogram showing the proportion of patients dying from different causes during different time intervals from the onset of their first-ever stroke.