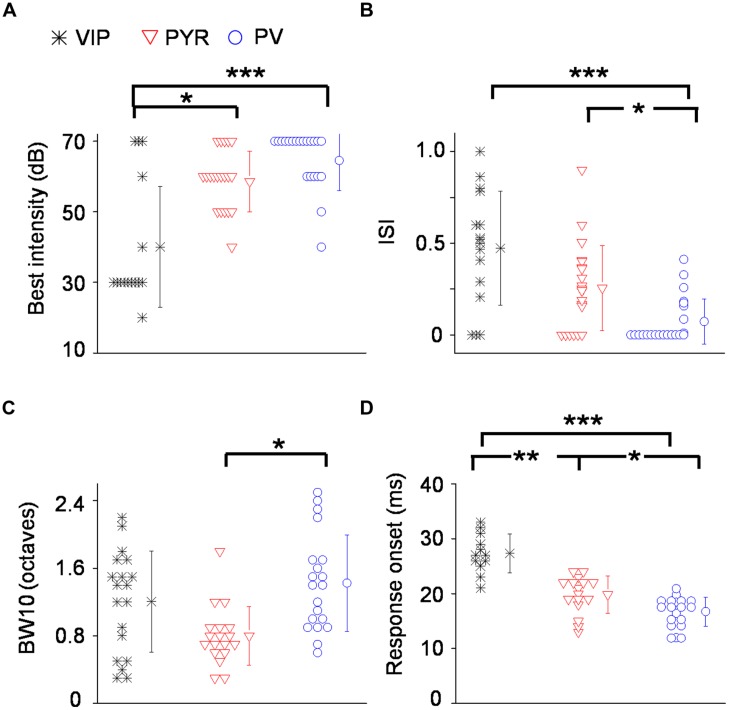
FIGURE 5.
Summary of auditory response properties of VIP neurons as compared to PV and pyramidal neurons. (A) Distribution of best intensities. N = 16 for VIP; 21 for Pyr; 22 for PV. (B) Distribution of intensity selectivity indices (ISI). (C) Distribution of TRF bandwidths (BWs) measured at 10 dB above intensity threshold (or at the threshold). (D) Distribution of spiking response onset latencies. ∗p < 0.05; ∗∗p < 0.01; ∗∗∗p < 0.001, Kruskal–Wallis and post hoc test.

