FIGURE 6.
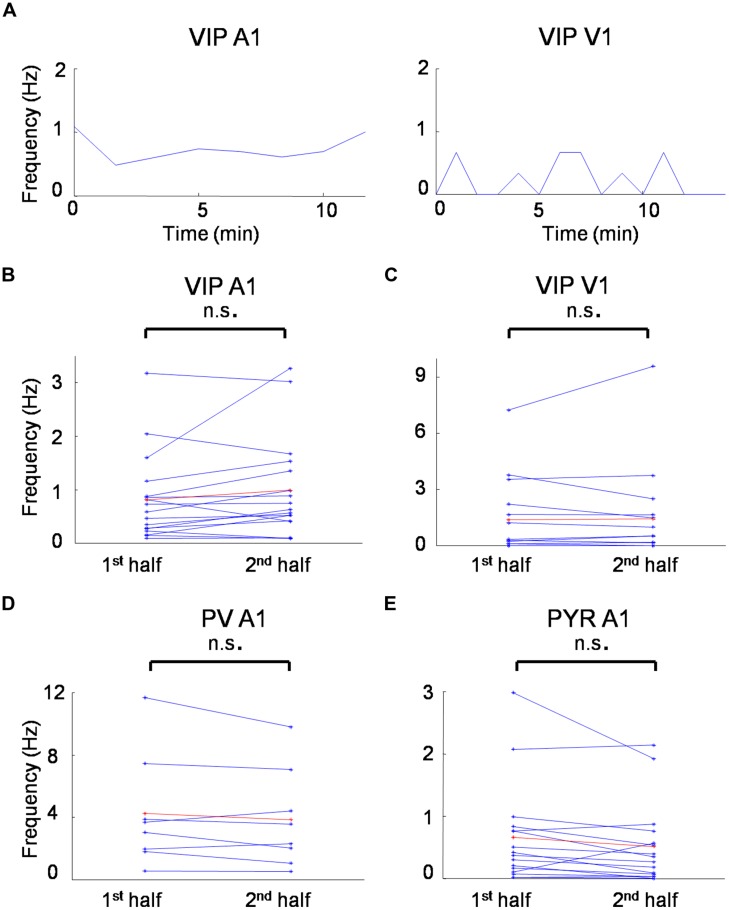
Spontaneous firing rates during recording sessions. (A) Time course of average spontaneous firing rates for a VIP neuron in the A1 (left) and a VIP neuron in the V1 (right). Each data point is the measure of average spontaneous firing rate during the receptive field mapping of one repetition. (B) Average firing rates for the first and second half duration of the recording session for all the VIP cells recorded in the A1. (C) Average firing rates for the first and second half duration of the recording session for all the VIP cells recorded in the V1. (D) Average firing rates for the first and second half duration of the recording session for all the PV cells recorded in the A1. (D) Average firing rates for the first and second half duration of the recording session for all the putative pyramidal cells recorded in the A1. n.s., non-significant, paired t-test.

