Figure 3.

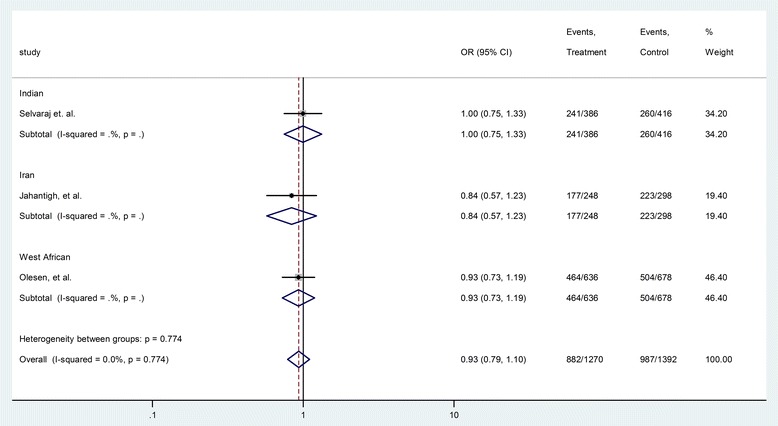
Forrest plot of the association between rs187084 and TB risk (T vs. C). Subgroup analysis was performed by ethnicity. OR: odds ratio; CI: confidence interval; df: degrees of freedom.

Forrest plot of the association between rs187084 and TB risk (T vs. C). Subgroup analysis was performed by ethnicity. OR: odds ratio; CI: confidence interval; df: degrees of freedom.