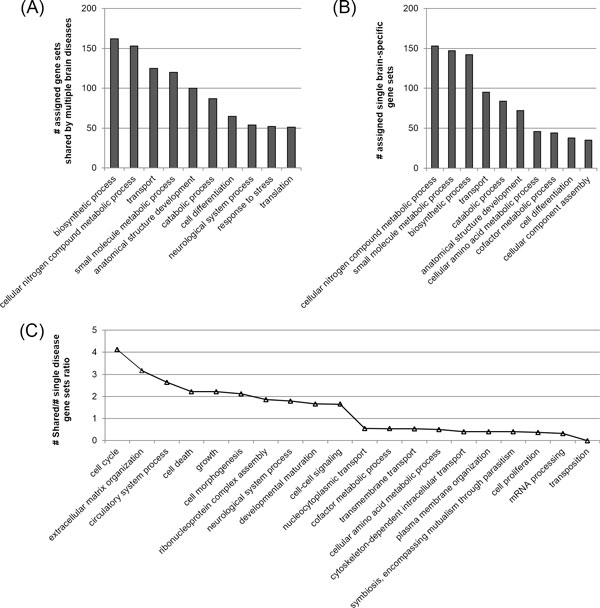
Figure 3.

Functional distribution of the shared gene sets and the single brain disease-specific gene sets. The x-axis shows the representative functional categories (biological processes) selected. (A)(B) The number of assigned gene sets shared by multiple brain disease and single brain-specific gene sets in each functional category. (C) Ratio of the number of shared gene sets over single disease-specific gene sets
