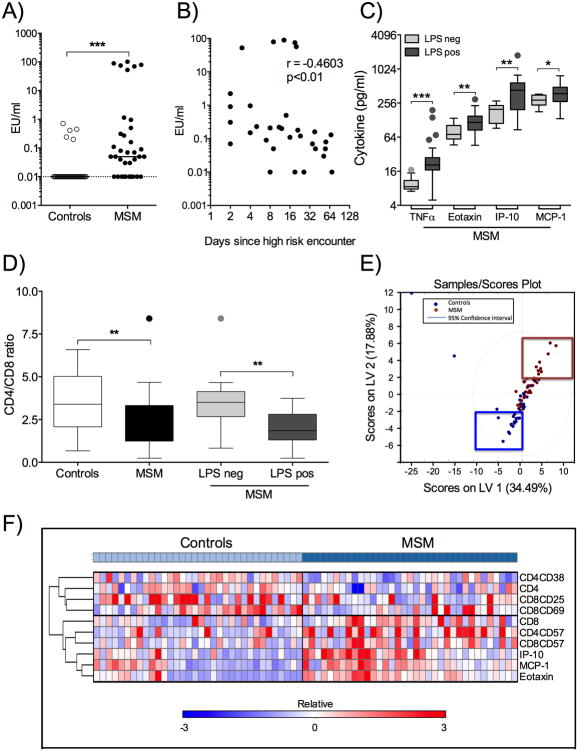
Figure 1. Analysis of Immune Profiles in MSM and controls.
A) Plasma samples from MSM (n=35, black circles) and controls (n=34, clear circles) were analyzed for endotoxin by LAL assay. Values are presented as endotoxin units (EU)/ml for each individual on a log10 scale (EU/ml range: 0-0.71 (controls); 0–101.6 (MSM)). Lowest values set for logarithmic graphing is shown by black dotted line (=0.01 EU/ml). B) Spearman correlation of LPS levels (EU/ml, log10) versus days since most recent high-risk exposure in MSM (n=32). C) Cytokine concentrations in MSM samples were stratified into endotoxin negative (n=10) and positive (n=25). Tukey box and whiskers plots of TNFα, Eotaxin, IP-10 and MCP-1 concentrations (pg/ml, log2) in endotoxin negative (detection limit, light grey boxes) and endotoxin positive (0.03-101.61 EU/ml, dark grey boxes) samples showing median, 5-95 percentiles and individual outliers. D) Tukey box and whiskers plots of CD4/CD8 ratios and group median for controls (n=34, white box), total MSM (n=35, black box) and MSM divided into LPS negative (n=10, light grey box) and LPS positive (n=25, dark grey box) with outliers shown. E) T cell marker and cytokine data were combined (n= 69) and analyzed by PLSDA comparing MSM with controls. PLSDA scores plot showing MSM (n=35, red dots) and controls (n=34, blue dots). F) Heat map clustering analysis of immune markers identified by PLSDA. Expression levels are displayed on a relative scale (-3 to +3) for each individual marker adjusted to group mean and standard deviation. Statistical significance is indicated as *p<0.05, **p<0.01 and ***p<0.001.

