Figure 2.
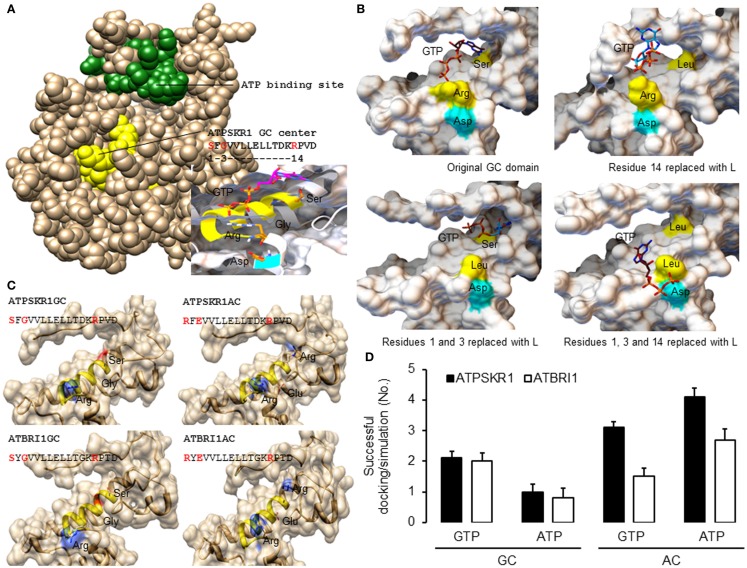
Homology models of Arabidopsis GC catalytic centers and molecular docking of GTP and ATP. (A) The homology model of ATPSKR1 kinase (Phe734–Val1008) illustrates the domain organization of the ATP binding site (green) and the moonlighting GC center (yellow) and the molecular docking of GTP to the GC center (inset) reveals substrate pose and interactions with key residues at the GC center. Ribbons highlighted in yellow and cyan indicates the GC catalytic center and the metal binding residue. (B) Docking simulations of GTP to ATPSKR1 GC catalytic center (Asn871–Glu980) that has one or more key amino acid residues replaced. Functional amino acid residues at positions 1, 3, and 14 of the motif are indicated in yellow and the residue that is involved in metal binding is highlighted in cyan. The substrate orientation was defined as “suitable for catalysis” if the hydrophobic nucleobase guanine or adenine sits deep at the catalytic center and at distance close enough to establish interactions important for catalysis with the experimentally determined functional residues at positions 1 and 3 of the motif while the negatively charged hydrophilic triphosphates point outwards toward the solvent exposed amino acid residue at position 14 of the motif (arginine or lysine) that has a positive net charge. In addition, this orientation also places the triphosphate end in the direction of interacting co-factors (Mg2+ or Mn2+) that bind with the amino acid (aspartic acid or glutamic acid) located two residues downstream of the motif. Figures were modified from Wong and Gehring (2013). (C) Models of the secondary and tertiary structures of ATPSKR1 (Asn871–Glu980) and ATBRI1 (Leu1021–Arg1134) catalytic centers at their native GC and GC-derived AC states. Residues at positions 1 and 3 were replaced with “R” and “E,” respectively, to match the AC motif, turning the GC catalytic centers of ATPSKR1 and ATBRI1 into putative ACs. The GC catalytic center (yellow ribbon) and the key catalytic residues are highlighted accordingly. All structures and images were prepared and analyzed using UCSF Chimera (Pettersen et al., 2004). (D) Docking simulations of GTP and ATP on the GC and the putative AC catalytic centers of ATPSKR1 and ATBRI1. A total of 10 docking simulations each were performed, generating nine solutions and the positive binding modes in each run were determined by analysis with PyMOL (ver 1.7.4) (The PyMOL Molecular Graphics System, Schrödinger, LLC), and the number of successful dockings per simulation were averaged. Homology models of ATPSKR1GC (Asn871–Glu980) and ATBRI1GC (Leu1021–Arg1134) were based on the AvrPtoB–BAK1 complex (PDB entry: 3TL8) using Modeller (ver. 9.10) (Sali and Blundell, 1993) and NTP docking experiments were performed using AutoDock Vina (ver. 1.1.2) (Trott and Olson, 2010).

