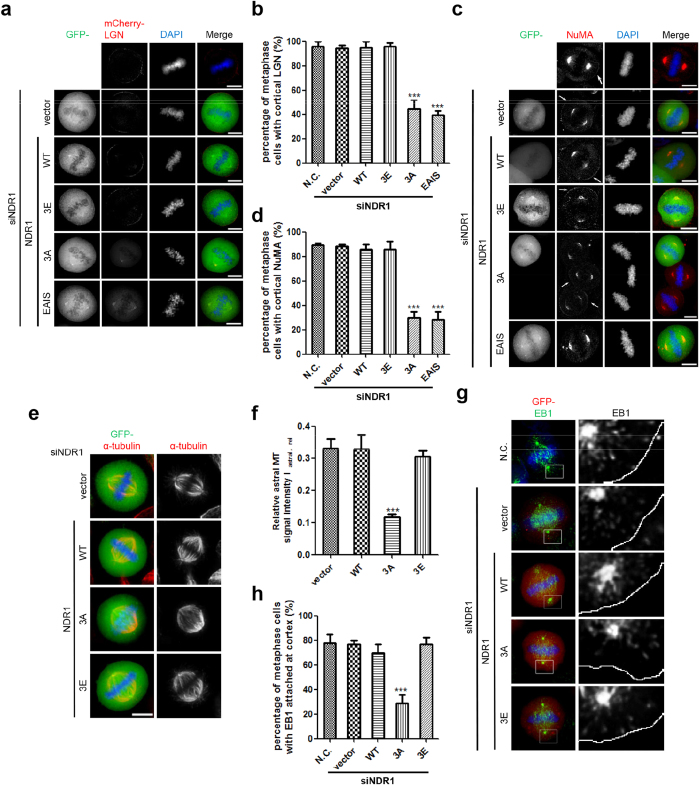
Figure 5. Phosphorylation of NDR1 by PLK1 is essential for cortical localization of LGN-NuMA (a).
Immunofluorescence analyses of mitotic HeLa cells expressing mCherry-LGN and GFP-NDR1 wild-type or mutants (WT, 3A or 3E) together with NDR1 siRNA. The scale bar represents 10 μm.(b) Percentage of metaphase cells with obvious enrichment of LGN at cell cortex as in (a). Bars indicate means±SD, n = 3, 40 cells for each experiment. The significant difference is evaluated by two-tailed student’s t-test and labelled.(c)Immunofluorescence analyses of mitotic HeLa cells expressing GFP-NDR1 wild-type or mutants (WT, 3A or 3E) together with NDR1 siRNA, using NuMA (red) antibody. In the 3A panel, the GFP positive cell indicates the transfected cell. The scale bar represents 10 μm. (d) Percentage of metaphase cells containing cortical NuMA signal as in (c). Bars indicate means ± SD, n = 3, 40 cells for each experiment. The significant difference is evaluated by two-tailed student’s t-test and labelled.(e) Immunofluorescence analyses of mitotic HeLa cells expressing GFP-NDR1 wild-type or mutants (WT, 3A or 3E) together with NDR1 siRNA, using α-tubulin antibody. The scale bar represents 10 μm.(f) Quantification of the relative signal intensities of astral microtubules compared to spindle microtubules as in (c). Bars indicate means±SEM from analyses of 30 cells. The significant difference is evaluated by two-tailed student’s t-test and labelled.(g) Immunofluorescence analyses of mitotic HeLa cells expressing GFP-NDR1 wild-type or mutants (WT, 3A or 3E) together with NDR1 siRNA, using EB1 antibody. One z-stack was shown for each construct. In the lower panel, EB1 signal channel was shown as black-and-white image, and the cell border was shown as white solid-line curve. The scale bar represents 10 μm.(h) Percentage of metaphase cells with EB1 signal reached cell cortex as in (g). Bars indicate means±SD, n = 3, 40 cells for each experiment. The significant difference is evaluated by two-tailed student’s t-test and labelled.

