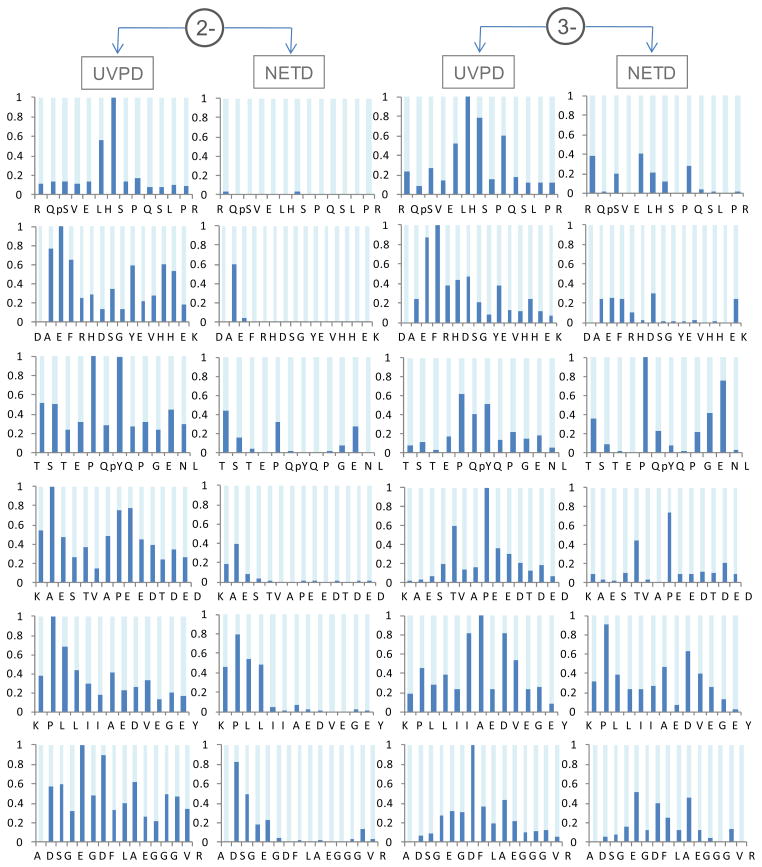
Figure 3.
Sequence coverage distribution comparison between UVPD and NETD of doubly and triply deprotonated peptide anions. The product ion signals were plotted for summed a/x pairs per backbone cleavage. For each peptide, ion signals were normalized to the highest a/x pair between the UVPD and NETD methods.

