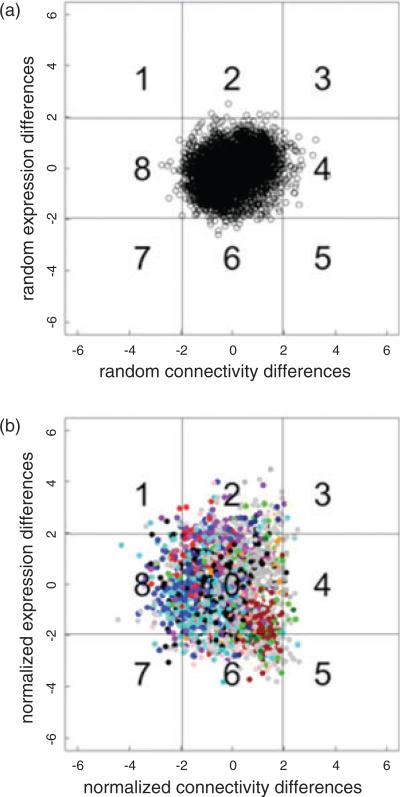
Figure 5. Differences in out-module network connectivity (x-axis) and expression level (y-axis) between high and low selected line datasets.
Differences are normalized based on empirical distribution of differences between random networks. Sector lines correspond to differences greater than 1.97 standard deviations. Genes were color coded as to module membership. Sectors 1, 7 and 8 – higher out-module connectivity in the low line; sectors 3, 4 and 5 – higher connectivity in the high line; sectors 5, 6 and 7 – higher expression in the low line; sectors 1, 2 and 3 – higher expression in the high line. (a) Differences between random networks. (b) Differences between networks inferred using high versus low line datasets.

