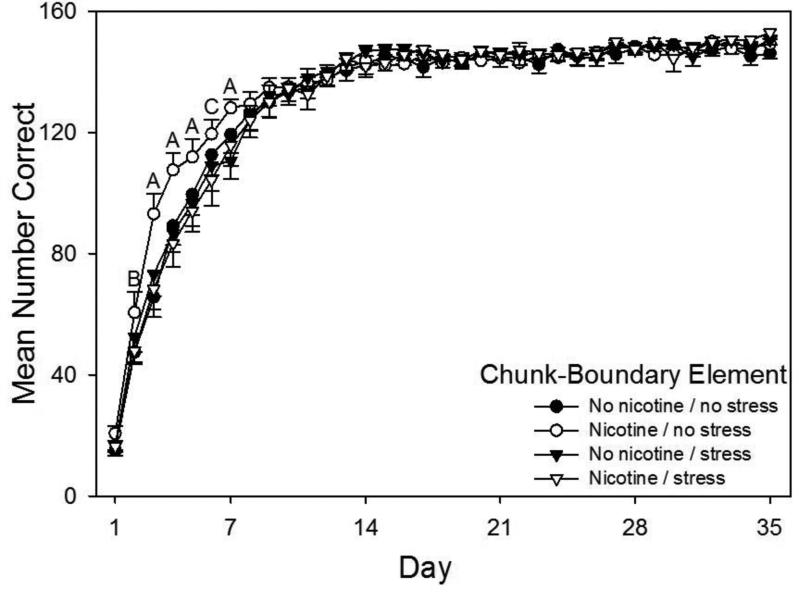
Fig. 3.
Acquisition curves for chunk-boundary elements of the pattern showing daily mean total correct responses over 35 days of training beginning on P65 for all four groups (N = 14-15 per group). Rats received prior adolescent exposure to either 0.033 mg/hr nicotine or an equivalent volume of saline via implanted osmotic pumps from P25-53. From P26-53 rats in the Stress conditions also received twice daily injections of 1 ml/kg saline. Letters above the Nicotine / No Stress acquisition curve indicate significant differences relative to other groups. “A” indicates days when Nicotine / No Stress rats made significantly more correct responses than rats in all other groups, “B” indicates 1 day when Nicotine / No Stress rats made more correct responses than the No Nicotine / No Stress and the Nicotine / Stress groups, and “C” indicates 1 day when Nicotine / No Stress rats made more correct responses than No Nicotine / Stress and the Nicotine / Stress rats (ps < 0.05). To summarize, female rats in the Nicotine / No Stress group made significantly more correct responses than all other groups on days 3, 4, 5, and 7, more correct responses than the No Nicotine / No Stress and the Nicotine / Stress groups on day 2, and more correct responses than rats in both Stress conditions on day 6. Error bars: ±SEM.

