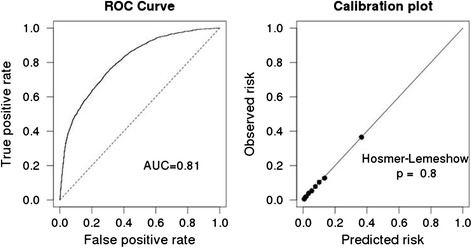
Fig. 3.

Performance evaluation of the multiple logistic regression model on a held-out test set (n = 17,169). a. Receiver Operating Characteristic curve for the test set, area under the curve (AUC) = 0.81. b. Calibration plot; Hosmer-Lemeshow P = 0.8
