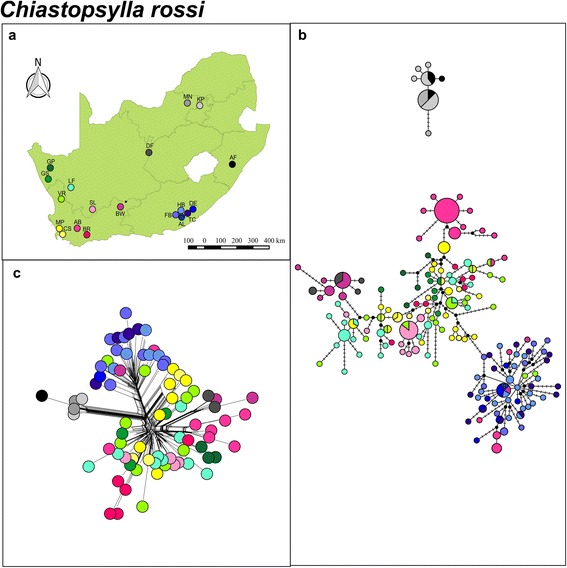
Fig. 7.

Chiastopsylla rossi nuclear EF1-α. a A map of geographical distribution of sampling localities in South Africa for C. rossi. b Statistical parsimony nuclear EF1-α haplotype network colour coded according to sampling locality. Circle size depicts frequency, branches depict single mutational steps, small black circles display intersections and cross hatching indicate missing haplotypes/mutational steps. c Neighbour-Net phylogenetic network for C. rossi
