FIGURE 1.
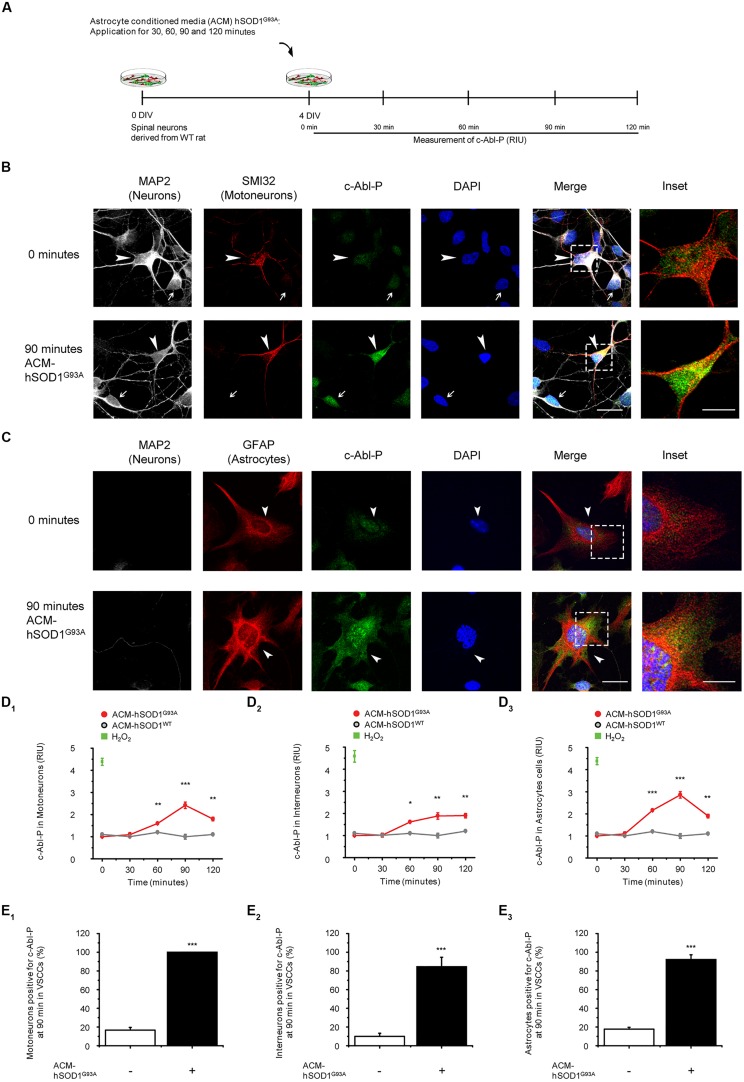
Exposure of primary spinal cord cultures to ACM-SOD1G93A induces increases in c-Abl phosphorylation. (A) Flow diagram of experiment. Primary wild-type (WT) rat spinal cord cultures (4 DIV) were exposed to ACM derived from transgenic mice overexpressing SOD1G93A (ACM-SOD1G93A) for 0–120 min. Next cultures were washed, fixed and immunostained with an antibody recognizing phosphorylated c-Abl (Tyr-412) and cell markers to define cell type. (B) Spinal cord cultures untreated (0 min; upper images) or treated with ACM-SOD1G93A for 90 min (lower images) were triple-labeled with anti-microtubule-associated protein 2 (MAP2) antibody (white) to visualize neurons (arrow show interneuron that is MAP2+/SMI32-), with the SMI-32 antibody (red) to identify motoneurons (arrowhead), and with the phospho-c-Abl antibody (green) to show active c-Abl. Cultures were also stained with DAPI to visualize their nucleus. Inset shows selected motoneuron in the merge. Scale bar, 25 μm. (C) Spinal cord cultures untreated (0 min; upper images) or treated for 90 min with ACM-SOD1G93A (lower images) were triple-labeled with anti-MAP2 antibody (white) to visualize neurons (arrows), with the GFAP antibody (red) to identify astrocytes (arrowhead), and with the phospho-c-Abl antibody (green) to show active c-Abl. Inset shows selected astrocyte in the merge. Scale bar, 25 μm. (D) Graphs showing the c-Abl-P fluorescent intensity (relative intensity unity; RIU) at 0, 30, 60, 90, and 120 min after application of ACM-SOD1G93A (red line): immunestaining was used to identify c-Abl-P within a particular cell type, including in motoneurons (D1; MAP2+/SMI32+), interneurons (D2; MAP2+/SMI32-), and glial cells (D3; MAP2-/GFAP+). Results obtained ACM-SOD1WT are also included (gray lines). In all experiment, H2O2 (200 μM for 20 min) served as positive control. Note that c-Abl-P fluorescence peaked in all three cell types after 90 min of incubation with ACM-SOD1G93A. (E) Graphs showing the percentage of motoneurons (E1), interneurons (E2), and glial cells (E3) positive for c-Abl-P after 90 min (at peak) of exposure to ACM-SOD1G93A. Values represent mean ± SEM from at least three independent experiments performed in duplicate, analyzed by ANOVA (D) or t-test (E). ∗p < 0.05, ∗∗p < 0.01, ∗∗∗p < 0.001 vs. control.

