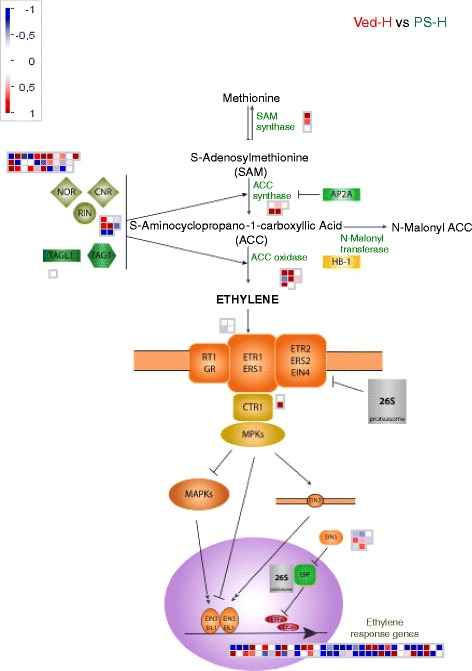
Fig. 7.

Differential expression of ethylene biosynthesis related genes in mature Ved and PS fruits. Differences in gene expression were visualised using MapMan [68]. The red squares represent genes that were more highly expressed in Ved and the blue squares the genes that were more highly expressed in PS. The genes and their expression levels are listed in Additional file 11: Table S8
